Published
3 years ago on
February 06, 2021
Bitcoin
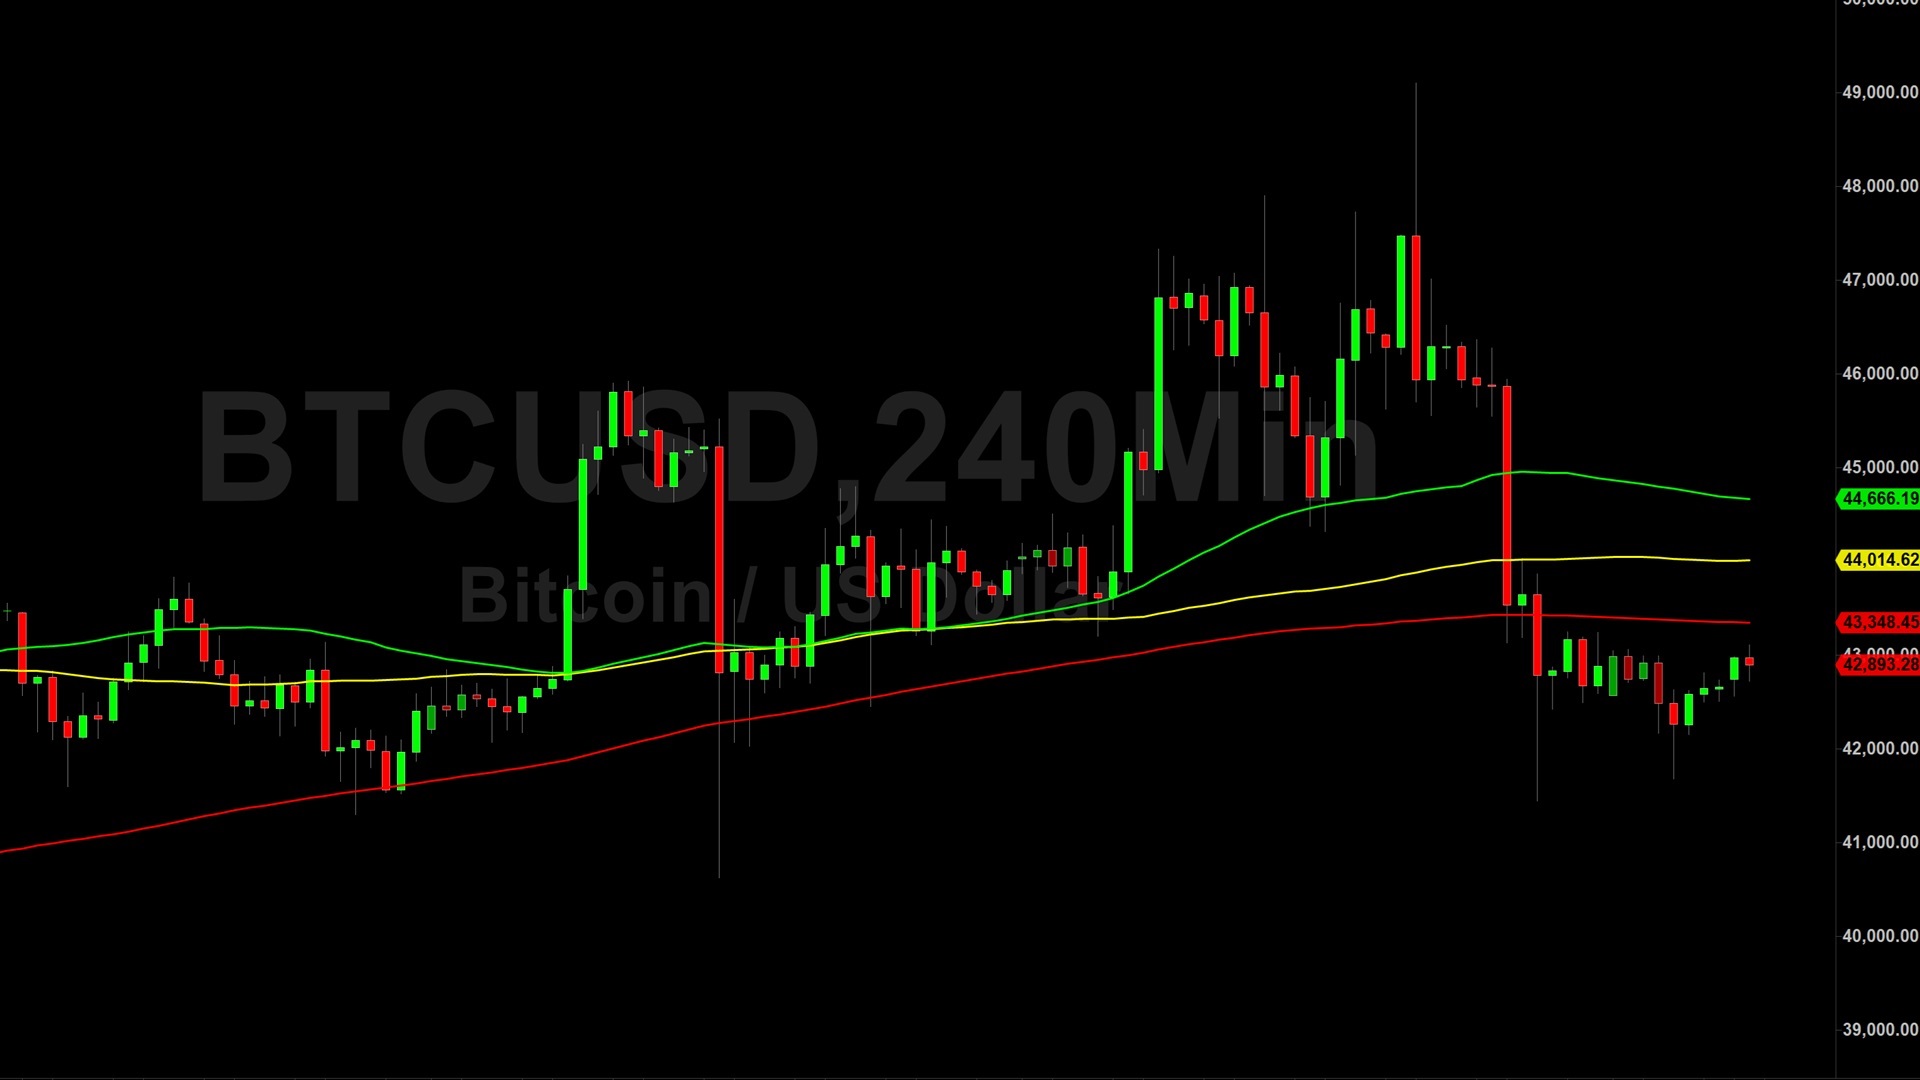
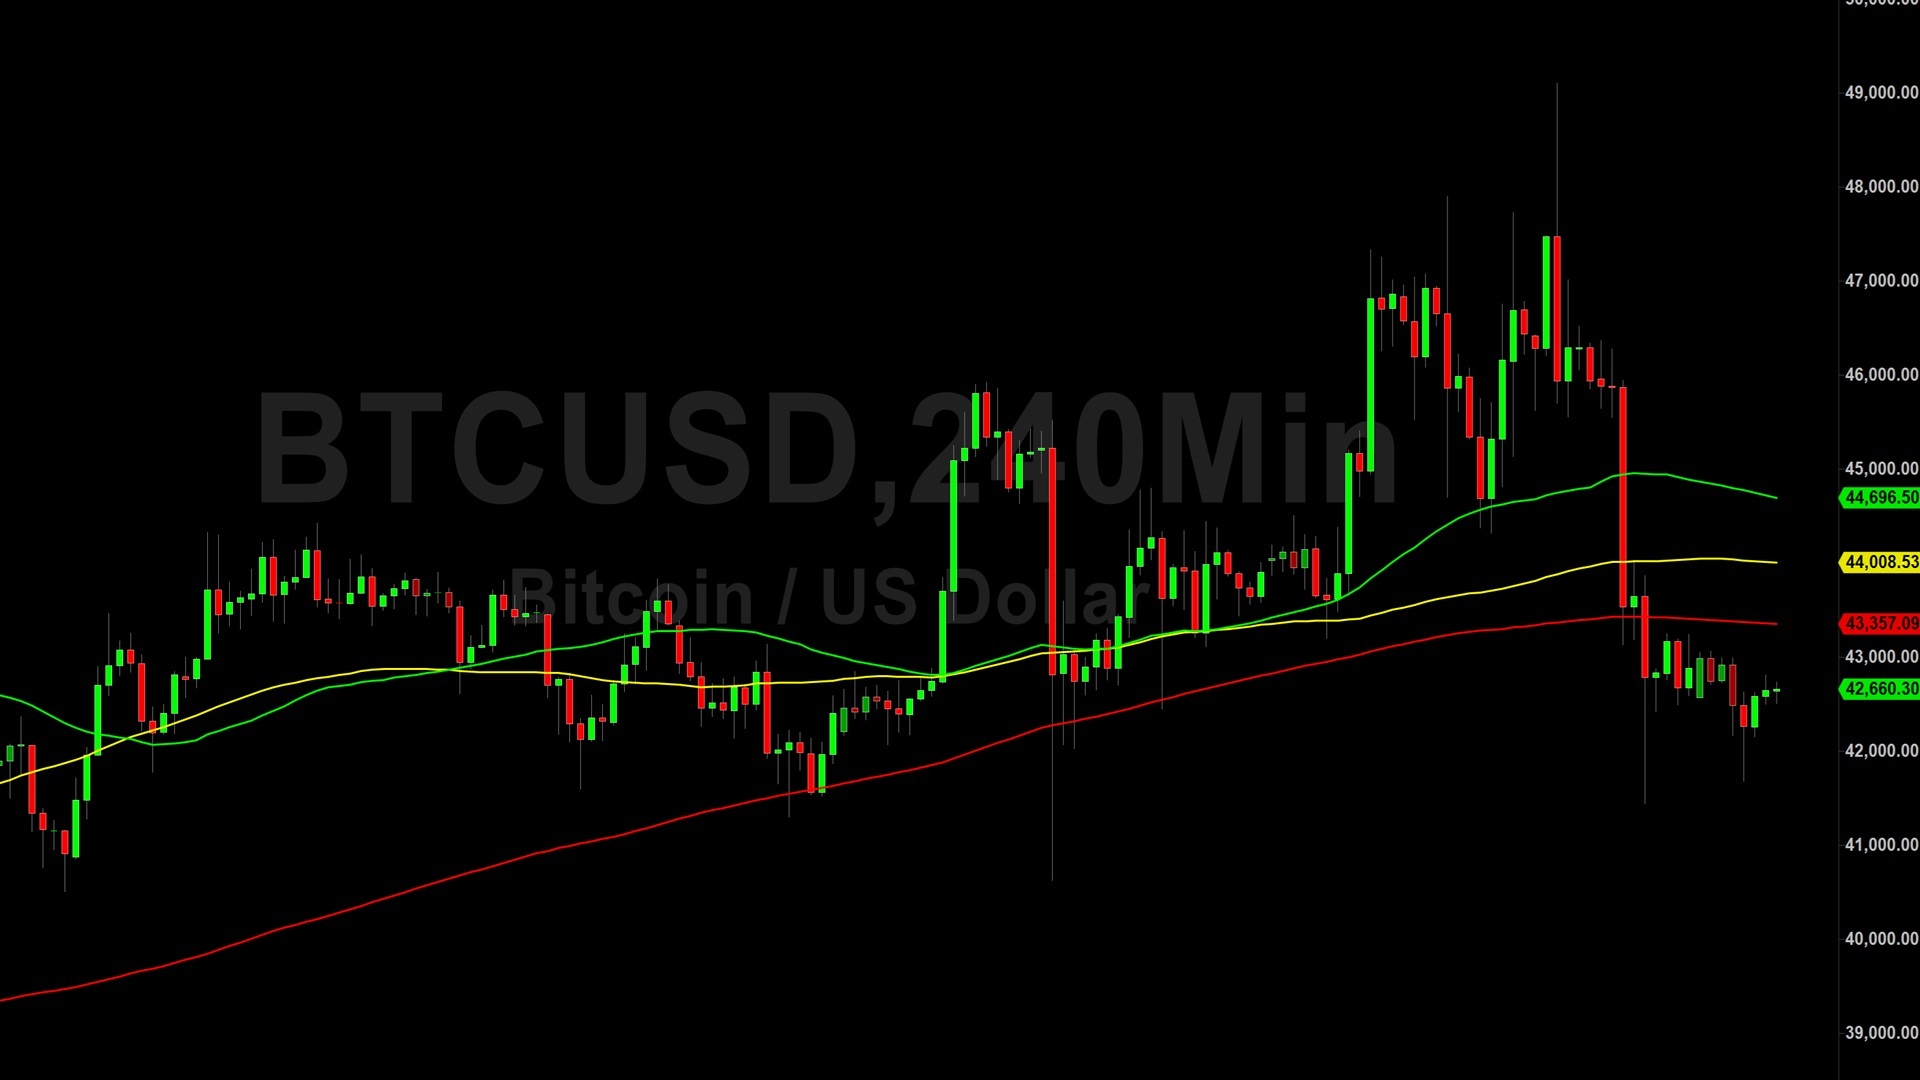
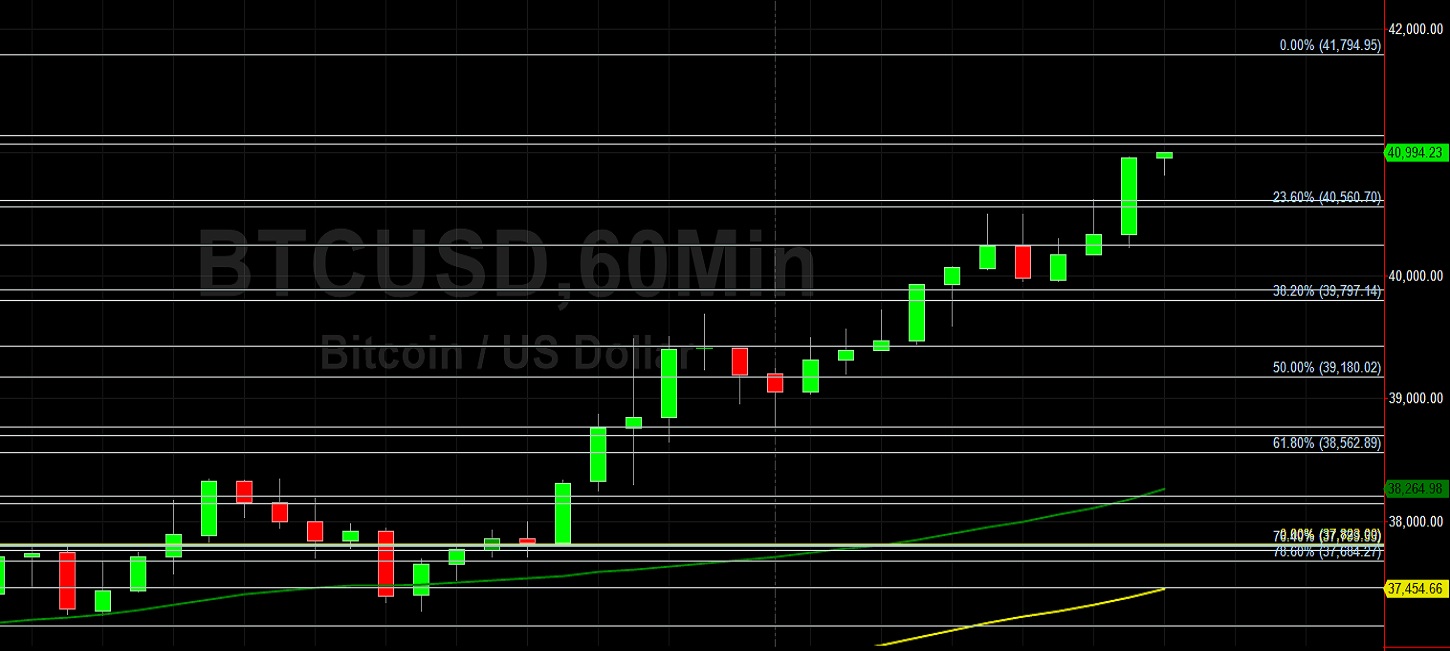
Bitcoin (BTC/USD) extended recent gains early in today’s North American session as the pair appreciated to the 40589.52 area after trading as low as the 37716 area during the Asian session, with recent price activity having tested the 50-hour simple moving average as technical support. Stopswere elected above the 38858.34 and 39149.93 levels during the move to multi-week highs, representing the 76.4% and 78.6% retracements of the depreciating range from 41986.37 to 28732. Stops were also elected above the 40127.66 levelduring the ascent, representing a recent relative high. If BTC/USD is able to take out and establish a new all-time high above the 41986.37 area, traders will focus on upside price objectives including 42701.91, 42803.53, 43447.48, 43617.07, 44023.07, 44118.38, and 44526.42.
Following the recent surge of BTC/USD, traders are carefully watching potential areas of technical support including the 38105.76, 36395.46, 35013.17, 33630.88, and 31920.58 levels. Traders also note that Stops were recently elected above the35943.73, 36480.83, and 36854.45 areas as well, upside price objectives related to previous buying pressure around the 17580, 16200, and 9819.83 levels and the sell-off intensified below these areas during the recent depreciation. Tradersare observing that the 50-bar MA (4-hourly) is bullishlyindicating above the 100-bar MA (4-hourly) and above the 200-bar MA (4-hourly). Also, the 50-bar MA (hourly) is bullishly indicating above the 100-bar MA (hourly) and above the 200-bar MA (hourly).
Price activity is nearest the 50-bar MA (4-hourly) at 35851.15and the 50-bar MA (Hourly) at 38263.70.
Technical Support is expected around 29783.19/ 29093.19/ 28847.31 with Stops expected below.
Technical Resistance is expected around 42309.01/ 42701.91/ 42803.53 with Stops expected above.
On 4-Hourly chart, SlowK is Bullishly aboveSlowD while MACD is Bullishly above MACDAverage.
On 60-minute chart, SlowK is Bullishly aboveSlowD while MACD is Bullishly above MACDAverage.
Disclaimer: This trading analysis is provided by a third party, and for informational purposes only. It does not reflect the views of Crypto Daily, nor is it intended to be used as legal, tax, investment, or financial advice
Investment DisclaimerBitcoin (BTC) Price Analysis: Bullish Test of 40256 Technical Support – 21 January 2024
Bitcoin (BTC) Price Analysis: Bears Eyeing 39225 Price Objective – 20 January 2024