Published
3 years ago on
October 03, 2020
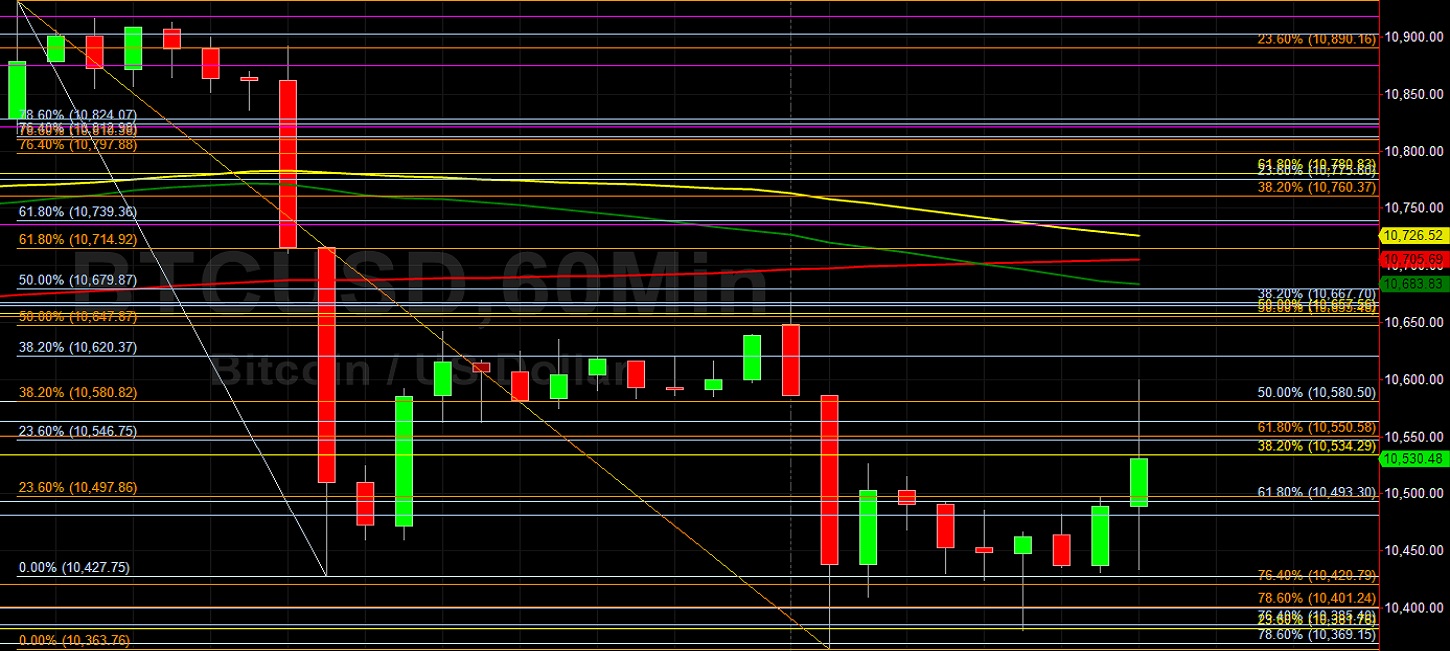
Bitcoin (BTC/USD) continued to lick its recent wounds early in today’s Asian session as the pair circled the 10500 level after selling pressure pushed it lower from the 10931.38 area during Thursday’s European session. Selling pressure intensified from the 10890.16 level, an area that represents the 23.6% retracement of the recent appreciating range from 10211 to 11099.95. Technical trading became evident after the pair reached the 10427.75 area, as the rebound was capped just below the 10679.87 area, representing the 50% retracement of the depreciation from 10931.98. Traders then knocked the pair lower to the 10363.76 area, just below the 10369.15 area that represents the 78.6% retracement of the recent appreciating range from 10211 to 10950. Chartists are observing that the 50-bar 4-hourly simple moving average is bullishly converging with the 100-bar 4-hourly simple moving average and the 200-bar 4-hourly simple moving average, and the 50-hour simple moving average has bearishly crossed below the 200-hour simple moving average. Stops were recently elected below the 11120, 11004.10, 10961.41, 10647.72, 10546.15, and 10450.26 areas during the recent depreciation from recent multi-week highs.
Traders note that the recent high of 12486.61 represented a test of the 12496.68 area, an upside price objective related to buying pressure that emerged around the 8055.91 area earlier this year. Traders also remain focused on the 12023.45, 11964.56, 11880.38, 11803.31, 11737.30, 11642.95, 11560.28, and 11533.51 areas during pullbacks higher, representing the retracements of the recent appreciating ranges that commenced around the 9005.00, 8905.84, 8815.01, and 8632.93 areas. Other important technical levels include the 11510.44 area, representing the 50% retracement of a historical depreciation from 19891.99 to 3128.89, as well as the 10200.39, 10139.11, and 10082.97 areas. Chartists are observing that the 50-bar MA (4-hourly) is bearishly indicating below the 100-bar MA (4-hourly) and above the 200-bar MA (4-hourly). Also, the 50-bar MA (hourly) is bearishly indicating below the 100-bar MA (hourly) and below the 200-bar MA (hourly).
Price activity is nearest the 200-bar MA (4-hourly) at 10705.09 and the 50-bar MA (Hourly) at 10683.87.
Technical Support is expected around 10135.22/ 9816.32/ 9861.42 with Stops expected below.
Technical Resistance is expected around 11179.90/ 11496.70/ 11601.04 with Stops expected above.
On 4-Hourly chart, SlowK is Bearishly below SlowD while MACD is Bearishly below MACDAverage.
On 60-minute chart, SlowK is Bullishly above SlowD while MACD is Bullishly above MACDAverage.
Investment Disclaimer