Published
3 years ago on
June 01, 2020
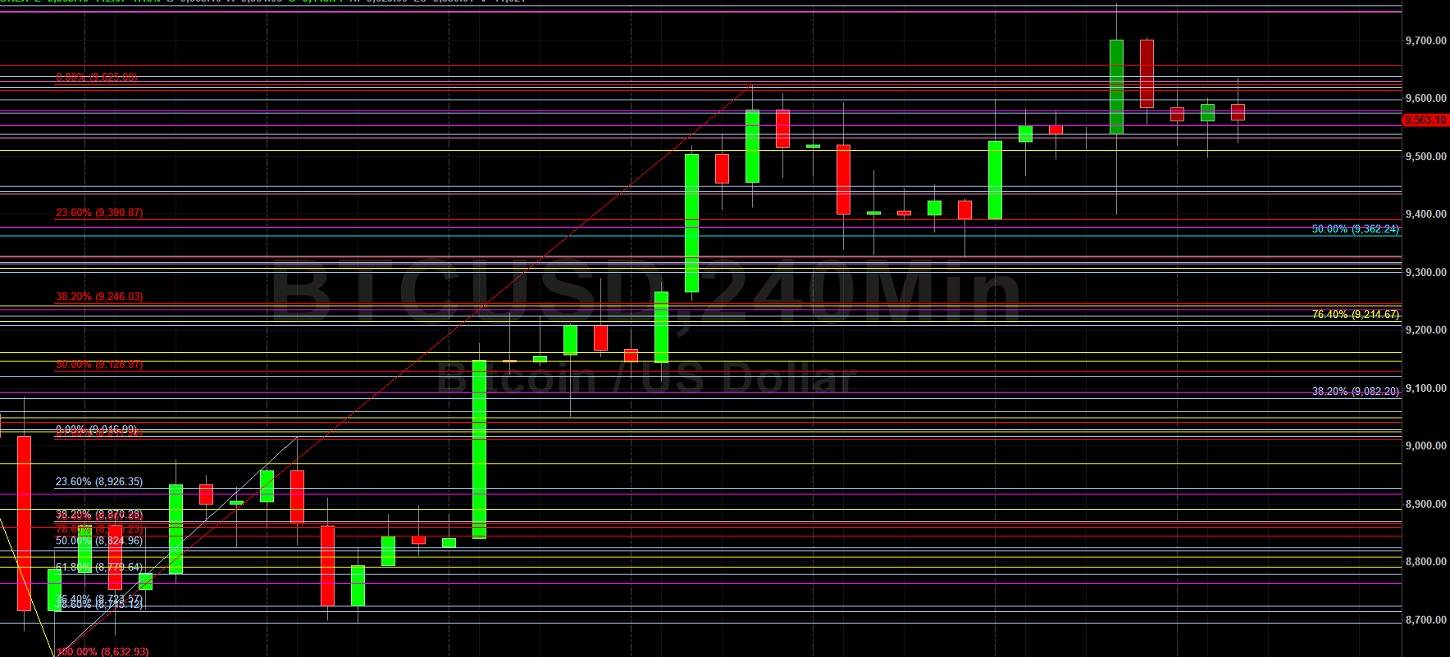
Bitcoin (BTC/USD) attempted to extend recent gains early in today’s Asian session as the pair continued to trade above the psychologically-important 9000 figure after trading as high as the 9764 area during yesterday’s Asian session. Some Stops were elected above the 9750.51 area during the pair’s move higher, an upside price objective relating to buying pressure that originated around the 3858 area in March. Some additional Stops were elected above the 9656.93 area during the pair’s move higher, a level that represents the 78.6% retracement of the recent depreciation from 10079 to 8106.70. During the recent move higher, Stops were reached above the 8890.13, 8969.58, 9049.03, and 9147.33 areas, representing the 38.2%, 50%, 61.8%, and 76.4% retracements of the recent depreciation from 9306.23 to 8632.93. Traders have also recently triggered Stops above the 9318.50 level, right around the 50% retracement of the recent depreciation from 9836.99 to 8800.00. Traders have also been closely monitoring the 9613.54 and 9656.93 areas, representing the 76.4% and 78.6% retracements of the recent depreciation from 10079.00 to 8106.70.
Additional important price retracement levels that traders are monitoring include the 9440.86 and 9592.26 levels. Traders are also paying attention to multiple trading ranges including the recent appreciation from 8106.70 to 9957.25, the appreciation from 6456.00 to 10079.00, the appreciation from 5678.20 to 10079.00, and the broader appreciation from 3858.00 to 10079.00. Important technical levels related to these ranges include 9040.41, 9025.32, 8808.52, 8695.01, 8610.84, 8540.29, 8398.89, 8267.50, 7878.60, 7839.99, 7702.58, 7359.31, and others. Chartists are observing that the 50-bar MA (4-hourly) is bearishly indicating below the 100-bar MA (4-hourly) and above the 200-bar MA (4-hourly). Also, the 50-bar MA (hourly) is bullishly indicating above the 100-bar MA (hourly) and above the 200-bar MA (hourly).
Price activity is nearest the 100-bar MA (4-hourly) at 9336.95 and the 50-bar MA (Hourly) at 9513.38.
Technical Support is expected around 8695.01/ 8540.29/ 8267.50 with Stops expected below.
Technical Resistance is expected around 10079.00/ 10316.39/ 10661.23 with Stops expected above.
On 4-Hourly chart, SlowK is Bearishly below SlowD while MACD is Bearishly below MACDAverage.
On 60-minute chart, SlowK is Bearishly below SlowD while MACD is Bearishly below MACDAverage.
Investment Disclaimer