Published
4 years ago on
April 06, 2020
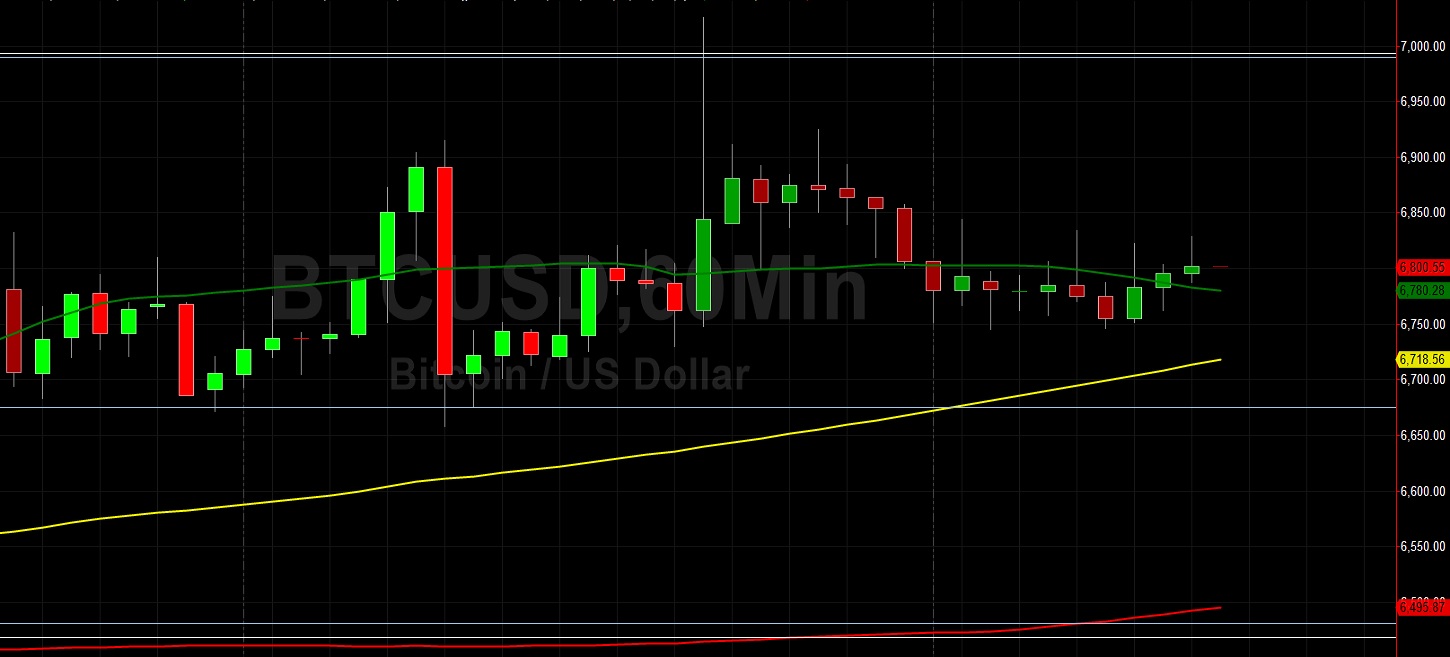
Bitcoin (BTC/USD) traded sideways early in today’s Asian session as the pair continued to orbit the 6800 figure after spiking to the 7025.33 area early in yesterday’s Asian session. Stops were elected above the 6949.09 level during the move higher, an area that represents the 50% retracement of the recent depreciation from the 7292.11 area to the 6606.06 area. The market tested the 7030.04 area during the appreciation higher to the 7030.04 area, a level that represents the 61.8% retracement of the depreciating range, but traders lacked the strength to push BTC/USD through the 7030 area. Following the pair’s depreciation back to the 6745.46 level after trading around the 7025 area, the pair has been unable to move above the 6852.45 level, representing the 38.2% retracement of that depreciating range.
Minor Stops were elected above the 6811.56 area, representing the 23.6% retracement of the depreciating range. These recent moves higher represents the pair’s first trading activity above the psychologically-important 7000.00 figure since early March when BTC/USD cratered from the 9214 area to the 3858 level. Above current price activity, upside price objectives include the 7414, 7561, 7716, and 7870 levels. Below current price activity, downside price objectives include the 6572, 6402, and 6192 levels. Chartists are observing that the 50-bar MA (hourly) is bearishly converging with the 100-bar MA (hourly), and that the 50-bar MA (4-hourly) has bullishly moved above the 100-bar MA (4-hourly).
Price activity is nearest the 200-bar MA (4-hourly) at 6764.98 and the 50-bar MA (Hourly) at 6783.18.
Technical Support is expected around 6572.63/ 6481.88/ 6383.48 with Stops expected below.
Technical Resistance is expected around 7414.53/ 7561.96/ 7716.85 with Stops expected above.
On 4-Hourly chart, SlowK is Bullishly above SlowD while MACD is Bearishly below MACDAverage.
On 60-minute chart, SlowK is Bullishly above SlowD while MACD is Bearishly below MACDAverage.
Investment Disclaimer