Published
4 years ago on
April 10, 2020
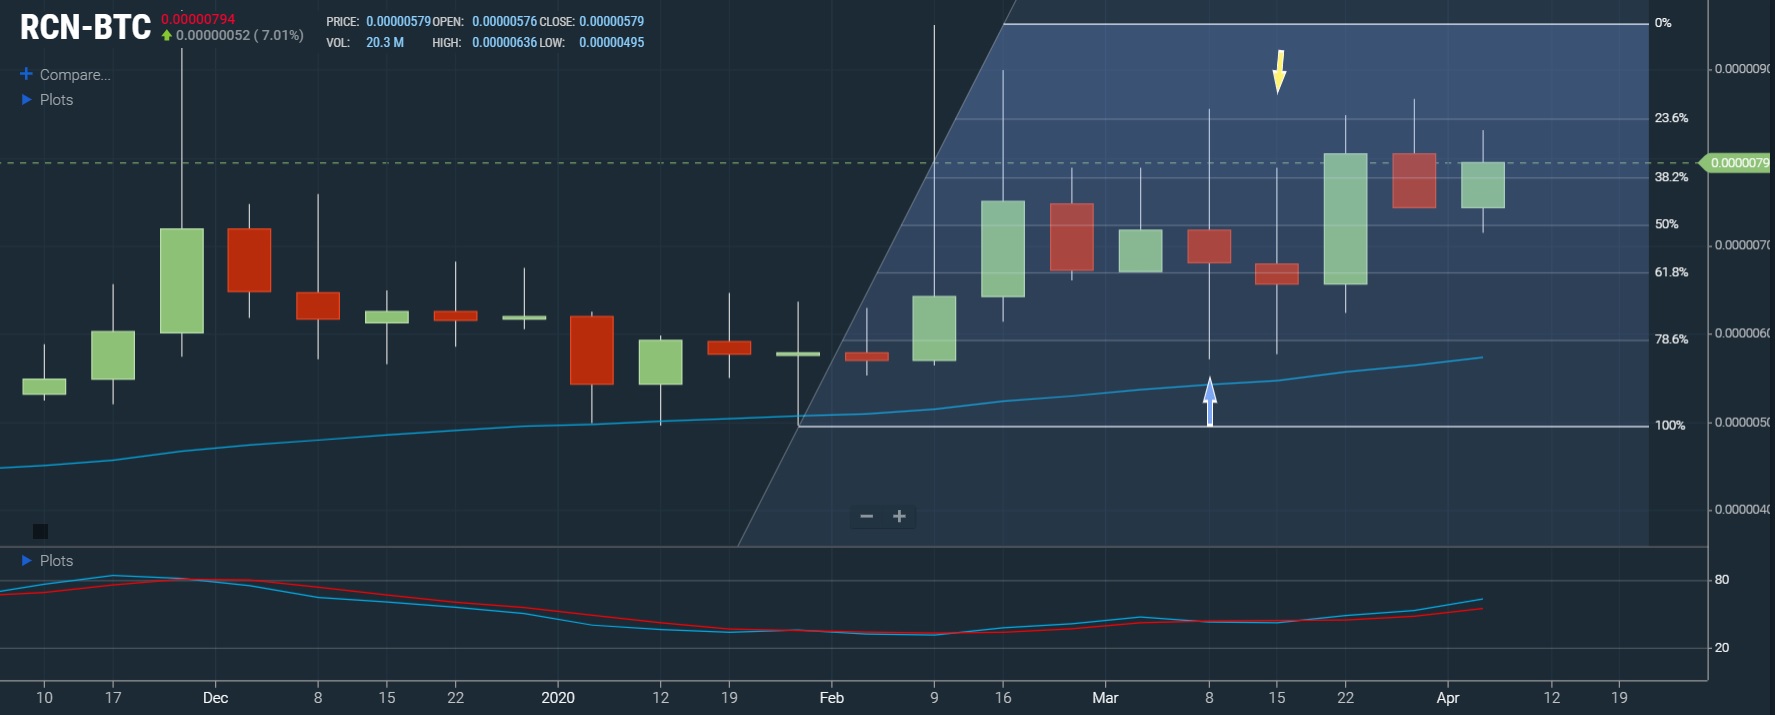
Chart of the Day – 10 April 2020
RCN/ BTC – Weekly
In this Weekly chart of Ripio Credit Network / Bitcoin (RCN/ BTC), there is an appreciating range from 0.00000495 to 0.00000950.
We can observe that the market then depreciated to the 0.00000571 level (identified by the blue up arrow), just below the 0.00000592 level that represents the 78.6% retracement of the appreciating range.
We can observe that this pullback was just above the 50-bar Exponential Moving Average, an indicator that provided some technical support.
We can observe that the market then appreciated to the 0.00000867 level (identified by the yellow down arrow), just above the 0.00000842 level that represents the 23.6% retracement of the appreciating range.
Thereafter, we can observe the market has been supported around the 50% retracement of the appreciating range.
The market has since appreciated further and is currently trading around the 0.00000796 level.
Traders will be curious to see if RCN/BTC can derive technical support around the 0.0000776 level during retracements lower, representing the 38.2% retracement of the appreciating range, as an indication that additional price appreciation may be likely.
Using Slow Stochastics, we can observe that the slope of Stochastics K started to turn positive and that Stochastics K bullishly crossed above Stochastics D after the market traded as low as 0.00000571, indicating price appreciation was likely.
Stay on top of the cryptocurrency market with CryptoDaily’s trading charts!
https://charts.cryptodaily.net/
Investment Disclaimer