
Published
4 years ago on
April 05, 2020
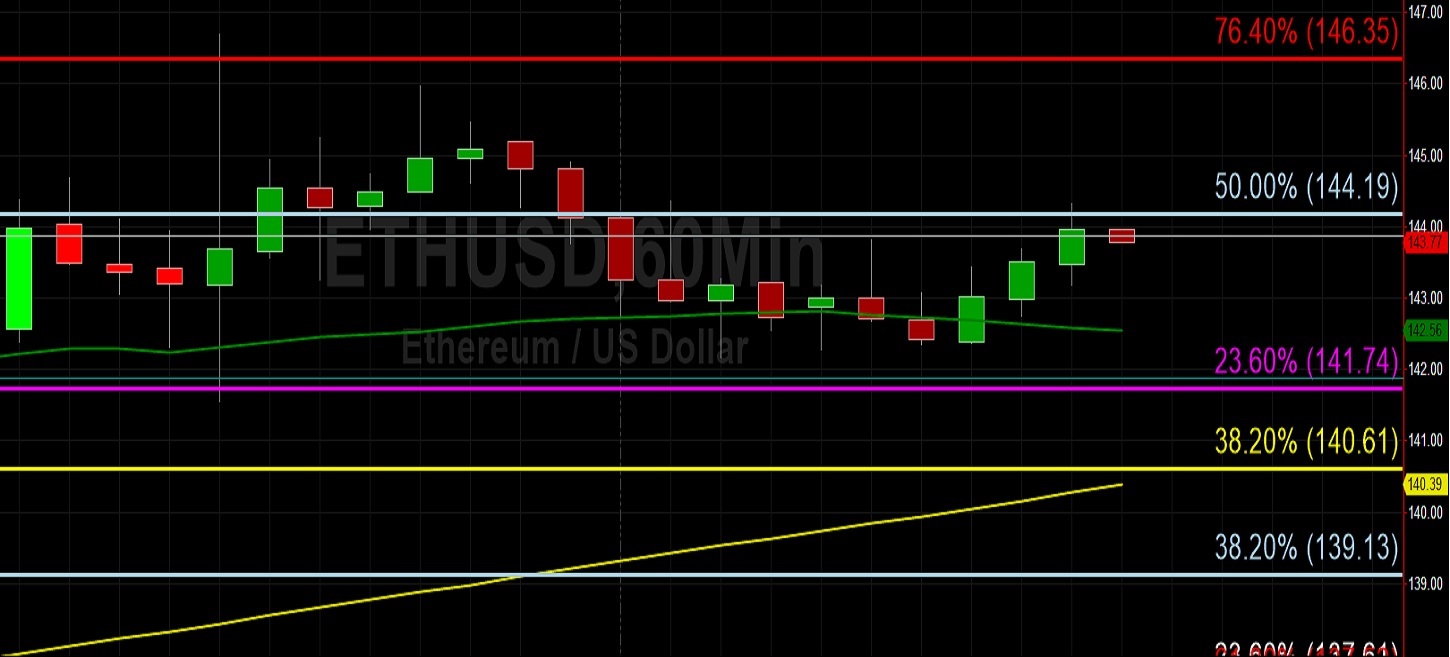
Ethereum (ETH/USD) gained some ground in today’s North American session as the pair appreciated to the 144.27 level after buying pressure emerged around the 142.16 level during yesterday’s European session. Stops were elected above the 144.25 and 145.73 levels during the recent appreciation, representing the 50% and 61.8% retracements of the prior depreciation from the 150.50 level to the 138.00 level. Traders lacked the conviction to test the 147.55 level, representing the 76.4% retracement of the same deprecating range. Chartists note that the 144.18 area also represents the 23.6% retracement of the appreciation from the 123.72 level to the 150.50 level, and this is a technically significant area that a lot of market liquidity has focused on during the past several trading sessions.
Market sentiment is decidedly more positive than it was in late March when the pair traded below the psychologically-important 125.00 figure. The recent price appreciation from last week represents the pair’s first trading activity above the psychologically-important 150.00 figure since 20 March, and traders will be curious to see if the 154.00 relative high from that date will be tested and absorbed. Above that area, traders will pay close attention to levels that were technically significant when price activity precipitously declined from the 253.01 area in early March. Above current market activity, upside price objectives include the 153.22, 156.77, 159.62, and 168.14 levels. Below current market activity, downside price objectives include the 137.11, 133.95, and 130.04 levels. Chartists are observing that the 100-bar MA (4-hourly) is bullishly remains below the 50-bar MA (4-hourly), and that the 50-bar MA (hourly) bullishly continues to indicate above the 100-bar MA (hourly) and 200-bar MA (hourly).
Price activity is nearest the 50-bar MA (4-hourly) at 135.67 and the 50-bar MA (Hourly) at 142.56.
Technical Support is expected around 130.09/ 125.16/ 119.84 with Stops expected below.
Technical Resistance is expected around 153.22/ 156.77/ 159.62 with Stops expected above.
On 4-Hourly chart, SlowK is Bearishly below SlowD while MACD is Bearishly below MACDAverage.
On 60-minute chart, SlowK is Bullishly above SlowD while MACD is Bearishly below MACDAverage.
Investment Disclaimer


