Published
4 years ago on
April 11, 2020
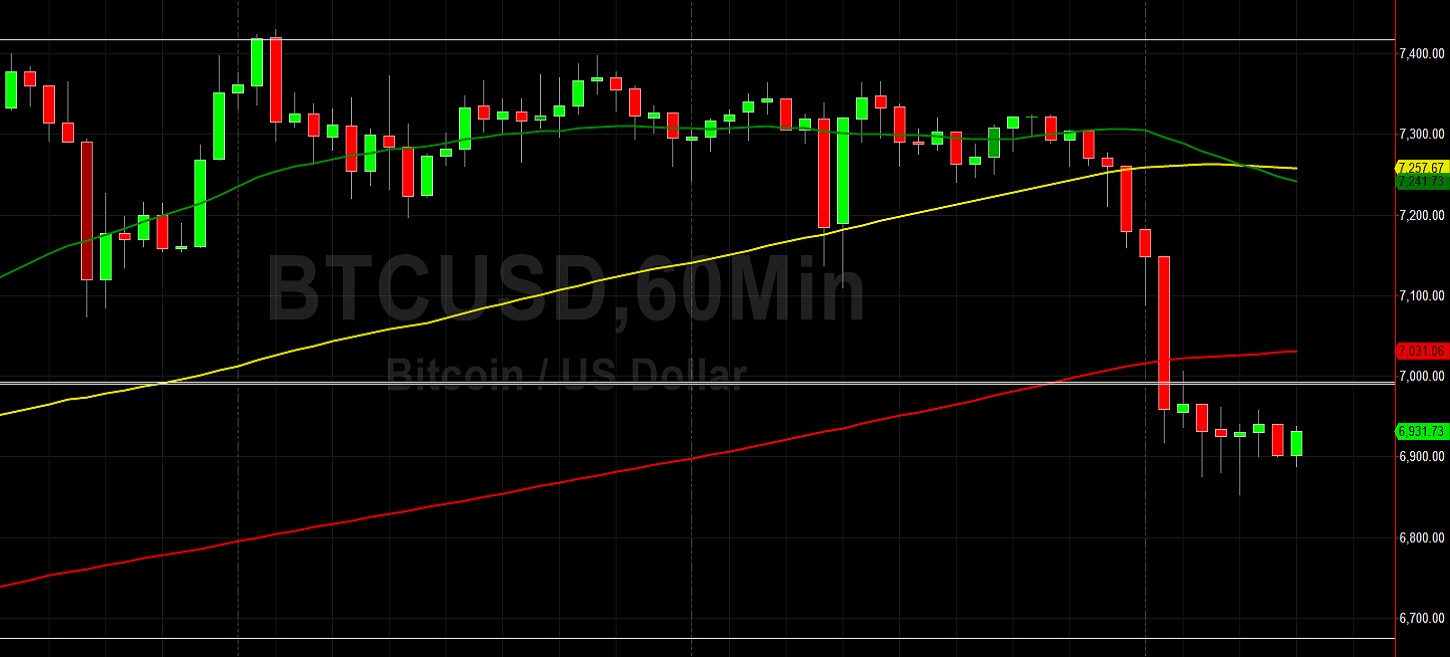
Bitcoin (BTC/USD) continued to consolidate early in today’s Asian session as the pair remained pressured below the psychologically-important 7000 figure after selling pressure knocked the pair lower from the 7323.55 level during yesterday’s Asian session. A number of larger Stops were elected around key levels, including the 7073.50, 6980.87, and 6866.26 areas, representing the 50%, 61.8%, and 76.4% retracements of the appreciation from 6681.00 to 7466.00. Larger Stops were executed below the 7081.51 area, representing the 23.6% retracement of the appreciation from 5853.00 to 7461.00. Notably, buying pressure emerged during yesterday’s European session just above the 38.2% retracement of the same range, an indication of the technical relevance of the move downward.
If BTC/USD is able to resume its recent upward trajectory, additional upside price objectives include the 7561, 7716, and 8103 areas. Additional Stops have recently been elected above the 6842 and 7059 levels, upside price objectives related to buying pressure last month around the 4432.30 area, and a related upside price objective is the 7870 level. Moreover, additional Stops were triggered above the 7234 area, an upside price objective related to buying activity around the 5001.00 area, and a related upside price objective is the 7761 area. Below current price activity, downside price objectives include the 6767, 6657, 6467, and 6232 levels. Chartists are observing that the 50-bar MA (hourly) has bearishly moved below the 100-bar MA (hourly), and that the 50-bar MA (4-hourly) bullishly remains above the 100-bar MA (4-hourly).
Price activity is nearest the 100-bar MA (4-hourly) at 6728.93 and the 200-bar MA (Hourly) at 7031.02.
Technical Support is expected around 6572.63/ 6481.88/ 6383.48 with Stops expected below.
Technical Resistance is expected around 7430.00/ 7561.96/ 7716.85 with Stops expected above.
On 4-Hourly chart, SlowK is Bearishly below SlowD while MACD is Bearishly below MACDAverage.
On 60-minute chart, SlowK is Bearishly below SlowD while MACD is Bearishly below MACDAverage.
Investment Disclaimer