Published
4 years ago on
April 12, 2020
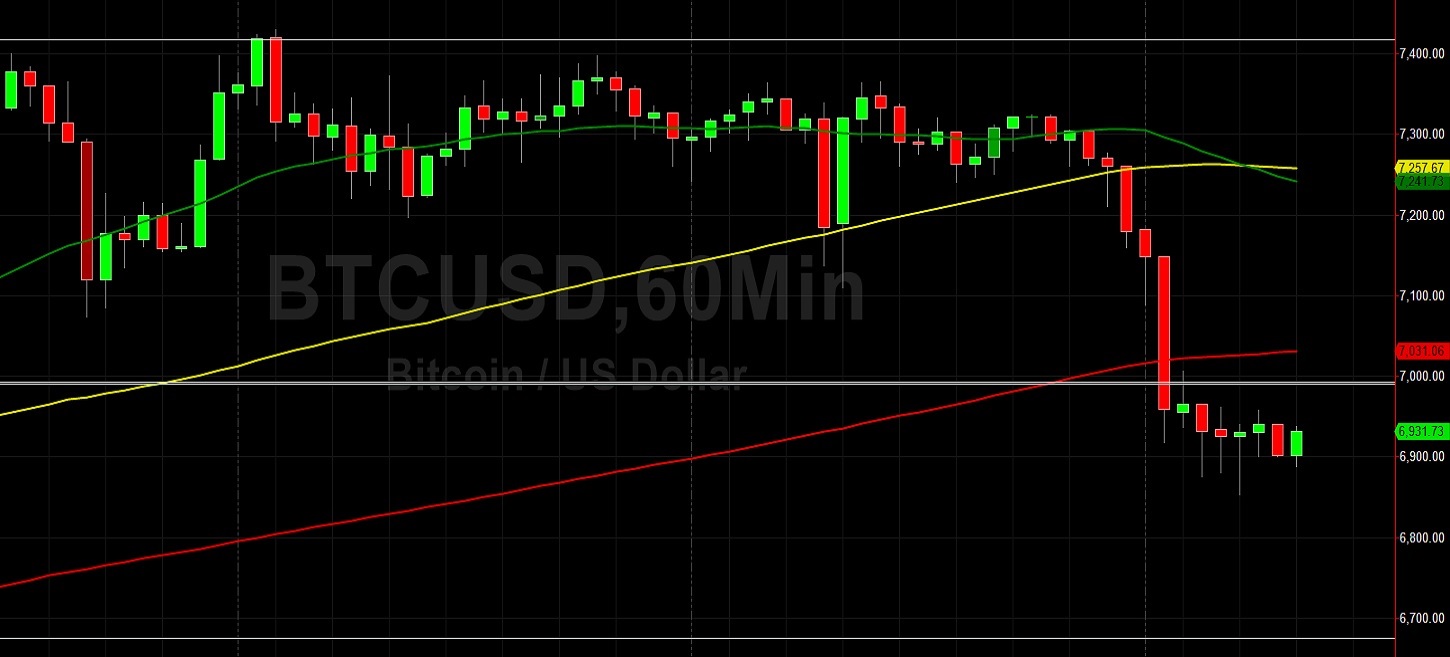
Bitcoin (BTC/USD) extended recent weakness early in today’s Asian session as the pair continued to fade below the psychologically-important 7000 figure after trading as high as the 6955 area during yesterday’s Asian session. Notably, this level was just above the 6949.09 area, a level that represents the 50% retracement of the depreciation from 7292.11 to 6606.06, and the next downside price objective in this range is the 6767.97 area. The failure of BTC/USD to close above this level is likely indicative of more weakness ahead. Some Stops were elected below the 6831.05 area during yesterday’s North American session, an area that represents the 61.8% retracement of the appreciation from 6750.00 to 6962.16, and the next downside target in this range is the 6800.07 area.
If BTC/USD is able to resume its recent upward trajectory, additional upside price objectives include the 7561, 7716, and 8103 areas. Additional Stops have recently been elected above the 6842 and 7059 levels, upside price objectives related to buying pressure last month around the 4432.30 area, and a related upside price objective is the 7870 level. Moreover, additional Stops were triggered above the 7234 area, an upside price objective related to buying activity around the 5001.00 area, and a related upside price objective is the 7761 area. Below current price activity, downside price objectives include the 6767, 6657, 6467, and 6232 levels. Chartists are observing that the 50-bar MA (hourly) has bearishly moved below the 200-bar MA (hourly), and that the 50-bar MA (4-hourly) bullishly remains above the 100-bar MA (4-hourly).
Price activity is nearest the 100-bar MA (4-hourly) at 6743.00 and the 50-bar MA (Hourly) at 7023.10.
Technical Support is expected around 6572.63/ 6481.88/ 6383.48 with Stops expected below.
Technical Resistance is expected around 7430.00/ 7561.96/ 7716.85 with Stops expected above.
On 4-Hourly chart, SlowK is Bearishly below SlowD while MACD is Bearishly below MACDAverage.
On 60-minute chart, SlowK is Bearishly below SlowD while MACD is Bullishly above MACDAverage.
Investment Disclaimer