Published
3 years ago on
May 01, 2020
Bitcoin (BTC/USD) pared some of its recent strong gains early in today’s Asian session as the pair moved lower toward the psychologically-important 8000 figure after trading as high as the 9478.66 level during yesterday’s European session. Large Stops were triggered above the 8763.40 level during the climb higher, a downside price objective related to selling pressure that commenced around the 9214.67 area in mid-March, before Stops were reached above the 9214.67 level itself. Additional major Stops were elected above the 9082.20 and 9362.24 levels, representing upside price objectives related to buying pressure that originated around the 3858.00 level in March. Earlier this week, Stops were elected above major levels during the pair’s appreciation to fresh multi-week highs, including the 7832.92 area that represents the 76.4% retracement of the recent depreciation from 7996.48 to 7335.79. Other important levels above which Stops were reached earlier this week are the 7751.67, 8162.36, and 8405.58 areas, downside price objectives related to selling pressure that commenced in February around the 10522.51 area.
Stops were also reached above the 8032.98, 8258.59, and 8484.22 areas during the climb, all of which represent downside price objectives related to selling pressure that commenced around the 9214.67 area in March. Traders will be curious to see how price activity reacts around these levels during the pair’s eventual depreciation. If BTC/USD is able to resume its upward trajectory, the traders will closely monitor additional upside price objectives around the 9575.05, 9750.51, and 9982.41 levels. When BTC/USD pulls back from current price activity, traders will pay close attention to some areas of potential technical support, including the 8324.00, 7967.33, 7610.66, 7423.22, and 7169.35 levels. Beyond these areas, traders will also pay close attention to levels including the 6959, 6767, 6403, 6383, 6291, and 6122 areas. Chartists are observing that the 50-bar MA (4-hourly) continues to indicate above the 100-bar MA (4-hourly). Also, the 50-bar MA (hourly) continues to indicate above the 100-bar MA (hourly), and continues to indicate above the 200-bar MA (hourly).
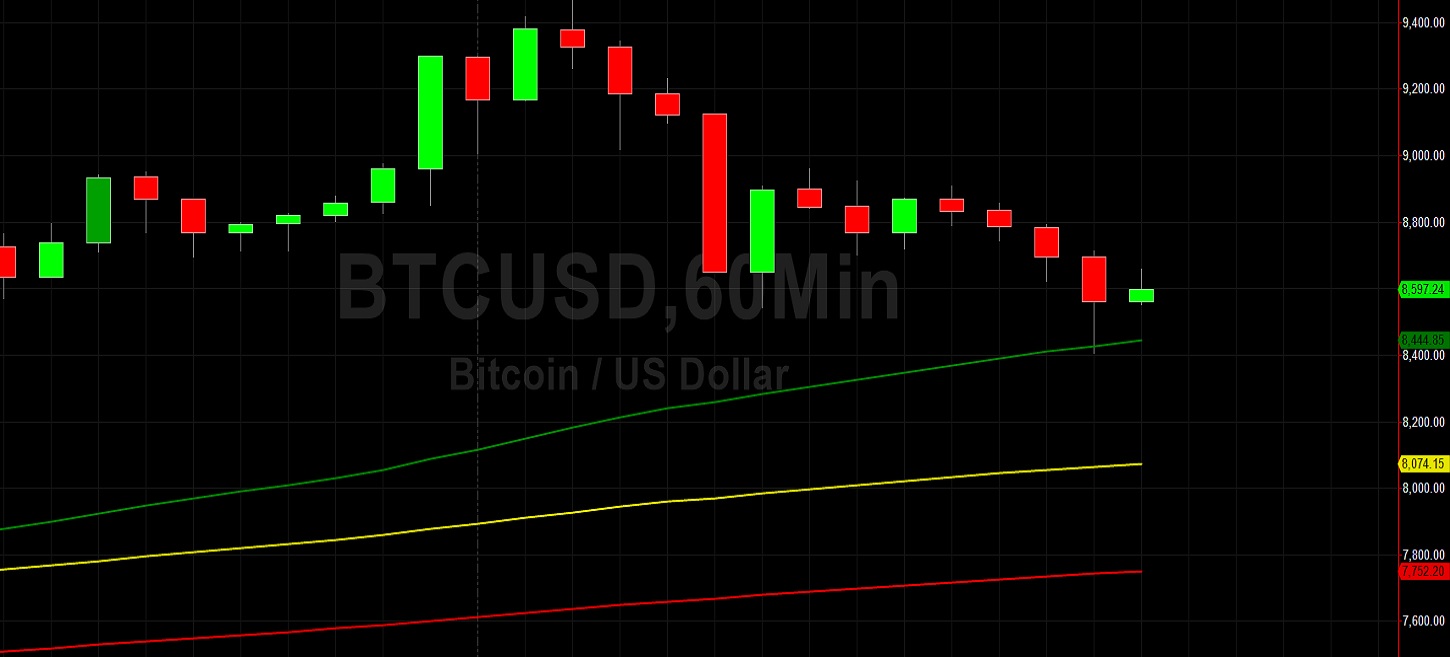
Price activity is nearest the 50-bar MA (4-hourly) at 7774.40 and the 50-bar MA (Hourly) at 8428.63.
Technical Support is expected around 8390.45/ 8020.78/ 7722.00 with Stops expected below.
Technical Resistance is expected around 9575.05/ 9750.51/ 9982.41 with Stops expected above.
On 4-Hourly chart, SlowK is Bearishly below SlowD while MACD is Bullishly above MACDAverage.
On 60-minute chart, SlowK is Bearishly below SlowD while MACD is Bearishly below MACDAverage.
Investment Disclaimer