Published
4 years ago on
March 23, 2020
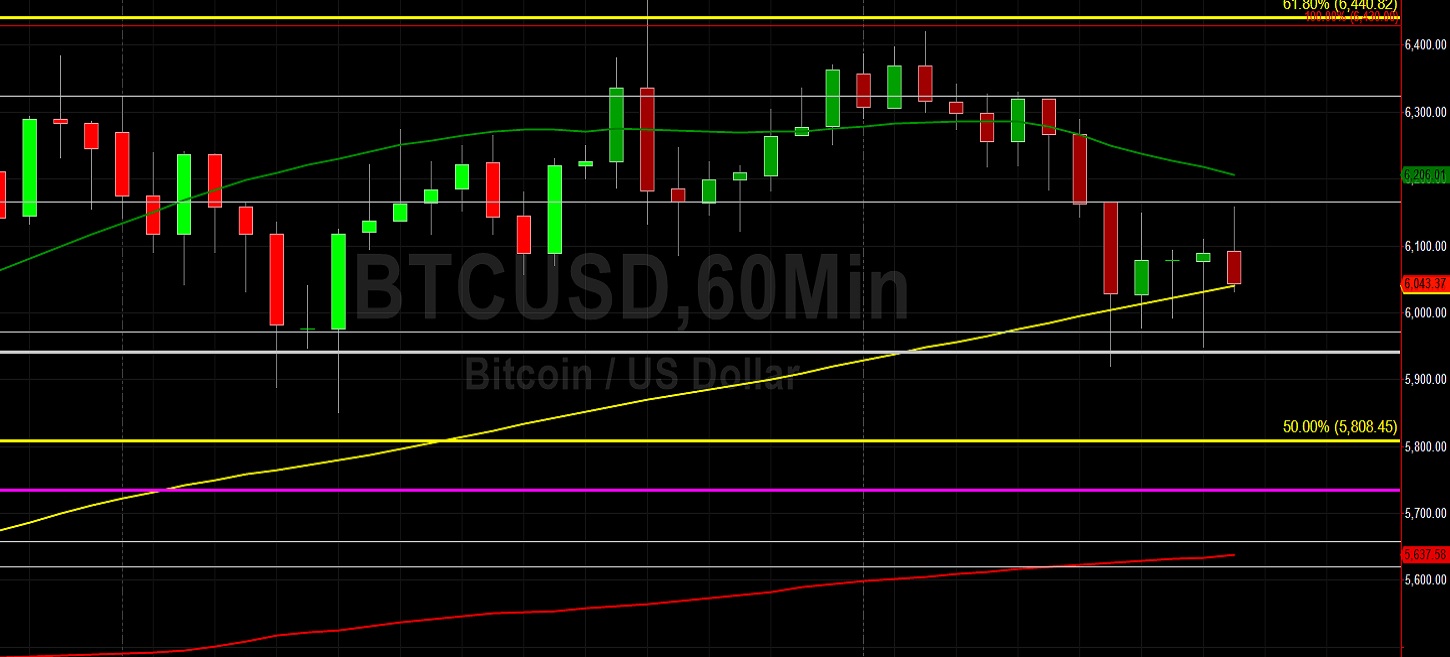
Bitcoin (BTC/USD) depreciated early in today’s Asian session as the pair traded as low as the 5976.07 level after trading as high as the 6420.00 level during yesterday’s European session. Trading activity was capped around the 6166.21 area during yesterday’s North American session, a level that represents the 38.2% retracement of the depreciation from 6990.00 to 5657.00. Above that area, the 6480.79 area represents the 61.8% retracement, followed by the 6675.41 area as the 76.4% retracement level. Traders continue to experience very volatile market conditions, rendering its quite challenging to determine market sentiment and a reliable trading bias. After opening the month around the 8525 area and escalating higher to the 9214 area, BTC/USD quickly depreciated to the 3858 area.
The pair then traded sideways before escalating from the 4309 area to the 6990 area and then depreciating sharply to the 5657.00 area. Stops were elected below many areas during the rapid decline, and these levels include the 6120, 6059, 6044, 5951, 5941, 5823, and 5799 levels. Above current market levels, traders are observing upside price objectives around the 7101.76, 7234.54, 7414.53, 7558.22, and 7761.66 levels. Below current market activity, traders are closely watching levels including the 4342, 3688, 2882, and 2673 levels. Stops are likely in place below these levels.
Price activity is nearest the 50-bar MA (4-hourly) at 5575.06 and the 100-bar MA (Hourly) at 6054.47.
Technical Support is expected around 4342.13/ 3688.61/ 2882.04 with Stops expected below.
Technical Resistance is expected around 7101.76/ 7234.54/ 7414.53 with Stops expected above.
On 4-Hourly chart, SlowK is Bearishly below SlowD while MACD is Bullishly above MACDAverage.
On 60-minute chart, SlowK is Bearishly below SlowD while MACD is Bearishly below MACDAverage.
Ethereum
Ethereum (ETH/USD) depreciated early in today’s Asian session as the pair fell to the 123.55 level after trading as high as the 137.64 area during yesterday’s Asian session. One range that traders are closely monitoring is the recent depreciation from the 154.00 area to the 115.51 level. The 134.76 level represents the 50% retracement of this range, and ETH/USD moved below this level during yesterday’s European session and was capped below that area during yesterday’s North American session. One level that ETH/USD continues to orbit is the 133.03 level, an upside price objective related to recent upward buying pressure around the 90.00 area. Trading activity this month has seen the market open March around the 218 level, climb to the 253 area, sharply depreciate to the 90.00 area, reclaim lost ground to the 154.00 area, and then depreciate to the 115.51 level.
Stops were elected above the 130.67 and 133.40 levels during the pair’s ascent late last week, eventually testing the 154.00 area, right around the 154.03 area that represents a downside price objective related to selling pressure that commenced around the 253.01 level on 7 March. During the pullback during Friday’s North American session, several Stops were triggered below many important short-term downside price objectives including the 135.99, 131.74, 127.54, 126.48, 119.36, and 117.98 levels. Upside price objectives include the 140.24, 143.19, 144.03, and 153.22 levels. Downside price objectives include the 116.59, 115.50, and 111.18 areas.
Price activity is nearest the 50-bar MA (4-hourly) at 124.55 and the 200-bar MA (Hourly) at 124.65.
Technical Support is expected around 119.84/ 115.51/ 110.18 with Stops expected below.
Technical Resistance is expected around 153.22/ 156.77/ 159.62 with Stops expected above.
On 4-Hourly chart, SlowK is Bearishly below SlowD while MACD is Bearishly below MACDAverage.
On 60-minute chart, SlowK is Bearishly below SlowD while MACD is Bearishly below MACDAverage.
Investment Disclaimer