Published
4 years ago on
March 10, 2020
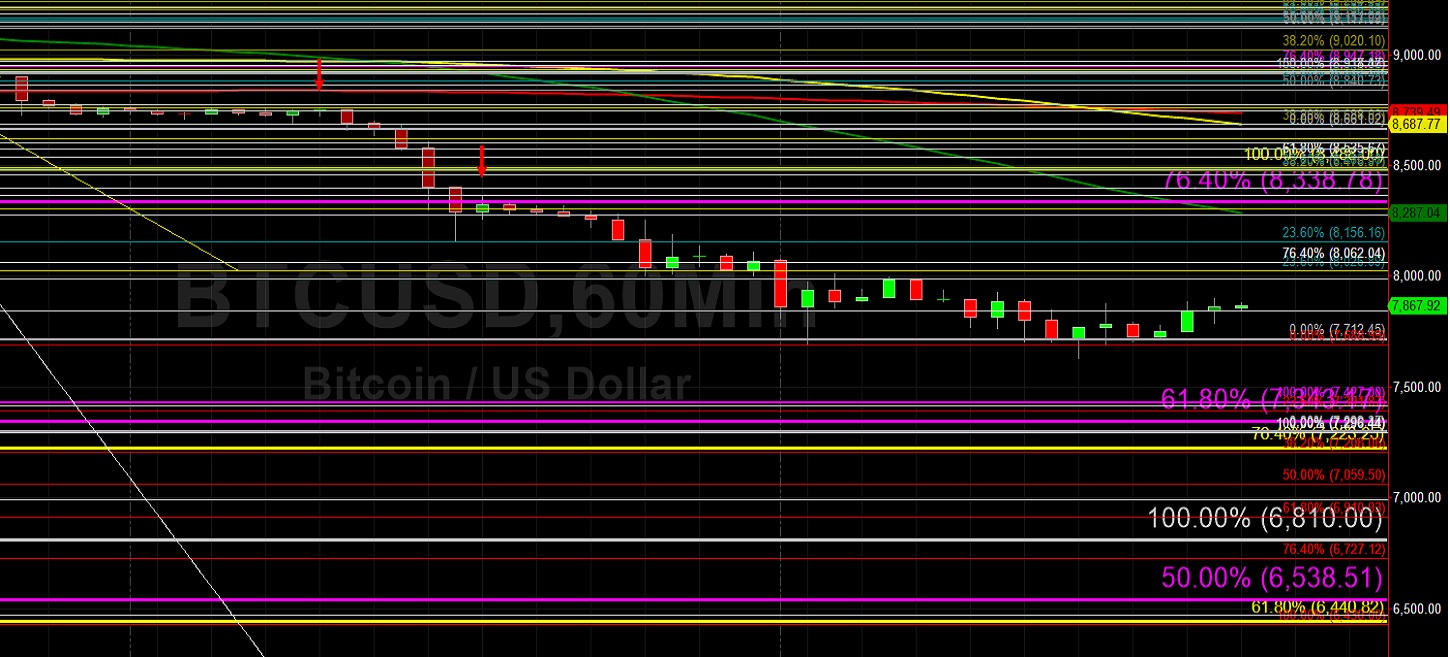
Bitcoin (BTC/USD) climbed marginally early in today’s Asian session as the pair gained ground to the 7900.00 area after encountering some buying pressure around the 7630.00 area during yesterday’s North American session. The most recent round of depreciation commenced during Saturday’s North American session when selling pressure pushed BTC/USD lower from the 9214.67 area, triggering a cascade of Stops along the way. Stops were elected below the 8320.67 and 7793.31 areas during the move lower, downside price objectives related to selling pressure that began in earnest on 24 February around the 10030.00 area. The pullback accelerated over the weekend when Stops were triggered below the 9022.41, 8903.47, and 8807.34 areas, representing the 23.6%, 38.2%, and 50% retracements of the move from 8400.00 to 9214.67.
Additional technical trading activity became evident during Sunday’s Asian session when the pair depreciated to the 8730.00 area, just below the 8745.80 area that represented a downside price objective related to selling pressure that emerged around the 9214.67 area and intensified around the 8925.00 level. The pair’s next downside price objectives related to these areas of selling pressure included the 8600, 8456, 8276, and 7987 levels, and each of these areas saw Stops elected below them during the decline. Additional downside price objectives include the 7417.31, 7265.95, 6693.10, and 6613.45 areas.
Price activity is nearest the 50-bar MA (4-hourly) at 8724.76 and the 50-bar MA (Hourly) at 8307.23.
Technical Support is expected around 7574.71/ 7265.95/ 6613.45 with Stops expected below.
Technical Resistance is expected around 8343.96/ 8592.95/ 8973.16 with Stops expected above.
On 4-Hourly chart, SlowK is Bullishly above SlowD while MACD is Bearishly below MACDAverage.
On 60-minute chart, SlowK is Bullishly above SlowD while MACD is Bullishly above MACDAverage.
Ethereum (ETH/USD) moved marginally higher early in today’s Asian session as the pair appreciated to the 199.68 area after finding buying pressure around the 189.85 area during yesterday’s North American session. Selling pressure intensified after Stops were elected below a range of downside price objectives related to a recent relative high around the 253.05 area, and these downside price objectives include the 214.17, 210.11, 208.03, 202.17, 199.98, and 197.41 levels. Another important level that traders tested is the 190.80 area, representing the 23.6% retracement of the move from 302.20 to 80.60.
Market sentiment has worsened over the past several trading sessions as the pair climbed above some of its recent trading range, traded as high as the 253.01 area, and then quickly weakened back below the 50-bar MA (hourly) and 100-bar MA (hourly). Stops were elected below the 243.21 and 237.15 areas during the pullback, representing the 23.6% and 38.2% retracements of the recent appreciation from 211.50 to 253.01. Technical trading activity became evident when bids halted the pair’s decline around the 231.78 area, just below the 232.26 area that represents the 50% of the appreciating range. Downside price objectives include the 184.27, 183.33, 181.74, 180.43, 170.76, and 167.17 areas.
Price activity is nearest the 50-bar MA (4-hourly) at 225.58 and the 50-bar MA (Hourly) at 214.30.
Technical Support is expected around 187.44/ 184.27/ 181.74 with Stops expected below.
Technical Resistance is expected around 209.25/ 217.55/ 225.01 with Stops expected above.
On 4-Hourly chart, SlowK is Bullishly above SlowD while MACD is Bearishly below MACDAverage.
On 60-minute chart, SlowK is Bullishly above SlowD while MACD is Bullishly above MACDAverage.
Investment Disclaimer