Published
4 years ago on
March 14, 2020
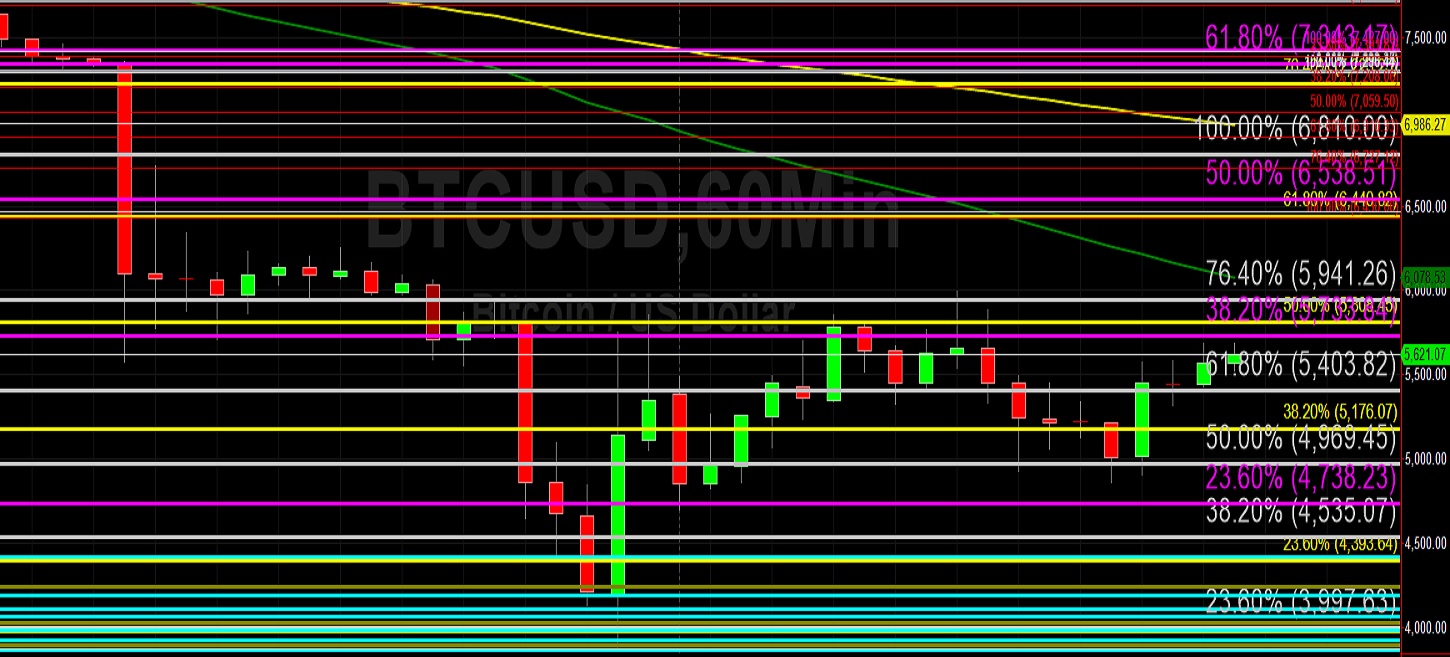
Bitcoin (BTC/USD) gained ground early in today’s Asian session as the pair climbed higher to the 5449.99 level after trading as low as the 3858.00 area during yesterday’s Asian session. The price activity represented the pair’s weakest level since March 2019 and occurred after traders elected Stops below a wide range of price levels during the massive depreciation and decoupling from risk. These price levels included the 7793, 7417, 7265, 6993, 6613, 6468, 6345, 5619, 5558, 5329, and 4509 levels. During the pair’s modest recovery, the pair as high gained ground to the 5885 level, came off to the 4696.55 area, gained ground to the 5995.00 level, and then fell back to the 4924.97 area before moderating.
Traders continue to observe the ongoing massive volatility in price activity wondering where sustainable technical support may emerge. Above current price activity, traders are paying close attention to some important technical ranges including the appreciation from 3128.89 to 13868.44 where the 7231.40 area represents the 61.8% retracement and the 5663.42 level represents the 76.4% retracement. A much broader range is the decline from the 19891.99 area to 3128.89 area and the 7084.98 level represents the 23.6% retracement. Below current market activity, traders were closely watching levels including the 4342, 3688, 2882, and 2673 levels. Stops are likely in place below these levels.
Price activity is nearest the 50-bar MA (4-hourly) at 7876.23 and the 50-bar MA (Hourly) at 6261.86.
Technical Support is expected around 4342.13/ 3688.61/ 2882.04 with Stops expected below.
Technical Resistance is expected around 6993.10/ 7417.31/ 7630.00 with Stops expected above.
On 4-Hourly chart, SlowK is Bearishly below SlowD while MACD is Bearishly below MACDAverage.
On 60-minute chart, SlowK is Bullishly above SlowD while MACD is Bearishly below MACDAverage.
Ethereum (ETH/USD) retraced some recent losses early in today’s Asian session as the pair traded as high as the 133.99 area after trading as low as the 90.00 area during yesterday’s Asian session. The pair spiked higher to the 148.00 level before moving to its weakest level since December 2018. The humongous sell-off that began around the 253.01 area on 7 March accelerated after major downside price objectives and associated Stops were easily absorbed by ETH/USD Bears, pushing the pair to its weakest level since late December 2018. ETH/USD extended recent losses this week as the pair sharply slumped to the 90.00 area after trading as high as the 196.58 area recently.
Following the pair’s recent depreciation from the 253.01 level, traders are contemplating whether or not the pair can remain above the psychologically-important 100.00 figure following its slump below this area during Friday’s Asian session. Some important technical ranges that traders are closely monitoring include the depreciation from the 199.50 area to the 116.25 area where the 135.90 level represents the 23.6% retracement. Likewise, the 141.76 area represents the 23.6% retracement of the move from 224.34 to 116.25 and the 132.90 area represents the 23.6% retracement of the depreciation from the 302.20 area to the 80.60 area. Downside price objectives that may serve as some technical support include the 95.66 and 80.60 levels.
Price activity is nearest the 50-bar MA (4-hourly) at 197.97 and the 50-bar MA (Hourly) at 142.22.
Technical Support is expected around 115.18/ 100.15/ 95.66 with Stops expected below.
Technical Resistance is expected around 140.95/ 144.19/ 150.17 with Stops expected above.
On 4-Hourly chart, SlowK is Bullishly above SlowD while MACD is Bearishly below MACDAverage.
On 60-minute chart, SlowK is Bullishly above SlowD while MACD is Bullishly above MACDAverage.
Investment Disclaimer