Published
4 years ago on
February 26, 2020
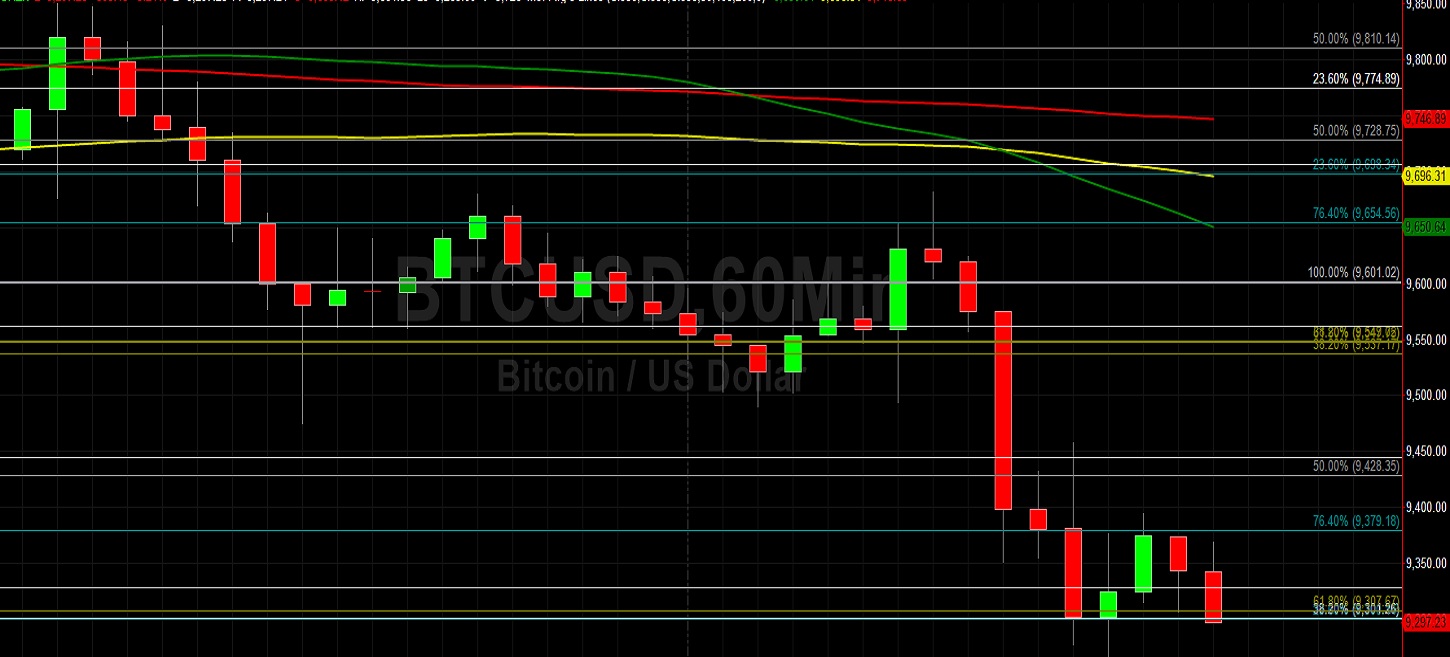
Bitcoin (BTC/USD) extended recent losses early in today’s Asian session as the pair fell to the 9265.00 area after trading as high as the 10030.00 area during Monday’s Asian session and the 9850.26 level during Monday’s European session. Sentiment continues to weaken as market has come off and since retraced some of the gains that it earned following its appreciation from the 6430.00 area that began around the middle of December. Longer-term chartists and technicians note that this recent relative peak was below the 10615.49 area, a level that represents the 61.8% retracement of the move from 13202.63 to 6430.00. The next downside retracement levels in this range include the 9017.14 and 8028.34 areas.
Additionally, that recent relative peak was also below the 9765.93 area, representing the 38.2% retracement of the move from 3128.89 to 13868.44. The next downside retracement level in this range is the 8498.67 area and the next upside retracement level in this range is the 11333.91 area. Perhaps the most important range that has recently impacted price activity is the considerably broader move from 19891.99 to 3128.89. Notably, the 9532.39 area represents the 38.2% retracement of this range, and that level again fell during yesterday’s North American session. The next upside retracement level in that range is the 11510.44 area and the next downside retracement level in that range is the 7084.98 area.
Price activity is nearest the 200-bar MA (4-hourly) at 9549.51 and the 50-bar MA (Hourly) at 9651.42.
Technical Support is expected around 9121.40/ 8760.98/ 8216.71 with Stops expected below.
Technical Resistance is expected around 10534.04/ 10652.04/ 10698.24 with Stops expected above.
On 4-Hourly chart, SlowK is Bearishly below SlowD while MACD is Bearishly below MACDAverage.
On 60-minute chart, SlowK is Bullishly above SlowD while MACD is Bearishly below MACDAverage.
Ethereum (ETH/USD) extended its recent depreciation early in today’s Asian session as the pair fell to the 245.78 area after trading as high as the 265.01 level during yesterday’s European session. After recently peaking around the 290.00 level, the market depreciated and later encountered additional selling pressure around the 287.13 area, a trading development that shifted some market sentiment lower. Chartists and technicians are evaluating these peaks and moves within the context of some broader historical ranges that have impacted price activity. One such range is the move from 364.49 to 116.25 where the 305.91 area represents the 76.4% retracement.
Given the market’s inability to test this level, some traders are focusing on the next downside retracement levels including the 240.37 area. Another broad range that has impacted price recently is the move from 547.57 to 80.60. The 314.17 area represents the 50% retracement of this range, and the next downside retracement level in this range is the 259.09 area, an area that the market moved below again yesterday. Below current market activity, traders are anticipating possible technical support around the 234, 230, 220, and 216 levels. Above current market activity, traders are anticipating technical offers around the 281, 293, 302, and 307 levels.
Price activity is nearest the 100-bar MA (4-hourly) at 259.20 and the 50-bar MA (Hourly) at 263.66.
Technical Support is expected around 230.27/ 226.38/ 222.73 with Stops expected below.
Technical Resistance is expected around 296.15/ 304.10/ 312.93 with Stops expected above.
On 4-Hourly chart, SlowK is Bearishly below SlowD while MACD is Bearishly below MACDAverage.
On 60-minute chart, SlowK is Bearishly below SlowD while MACD is Bearishly below MACDAverage.
Investment Disclaimer