Published
4 years ago on
February 02, 2020
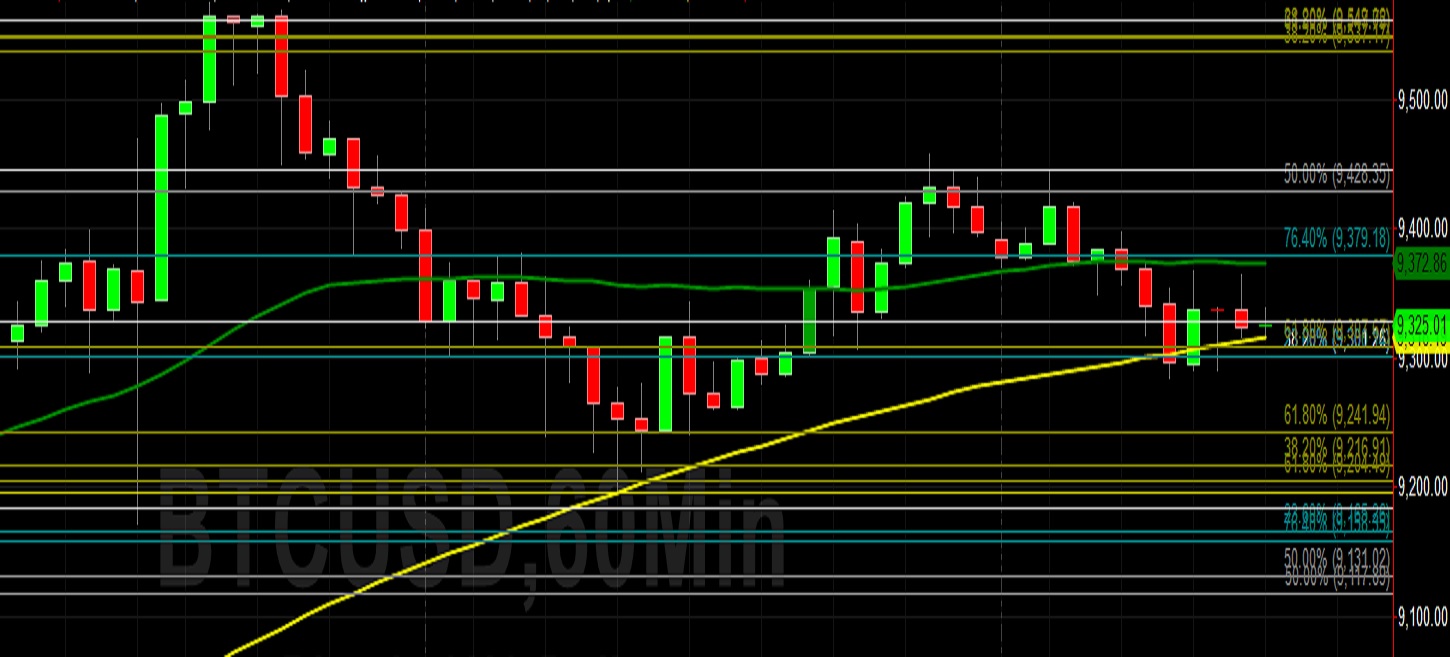
Bitcoin (BTC/USD) gained moderate ground early in today’s Asian session as the pair was lifted to the 9367.27 area after trading as high as the 9458.08 area during yesterday’s North American session. The pair has recently traded above the psychologically-important 9000 level for the second time this year as traders last week again tested selling pressure around the 9188 area. As BTC/USD has inched closer to the psychologically-important 10000 figure, traders and chartists have been paying closer attention to areas of technical significance, including the 9271.47 area that represents 38.2% retracement of the 13868.44 – 6430.00 range. The next upside retracement level related to this range is the 10149.22 area.
Another important level is the 9816.32 area, representing the 50% retracement of the move from 13202.63 to 6430.00. The next downside price level in this range is the 9017.14 area, a level that price activity again tested earlier last week. Additionally, the 9765.93 area is another technically-significant level, representing the 38.2% retracement of the move from 3128.89 to 13868.44. Moreover, the 9532.39 area represents the 38.2% retracement of a much wider range, the move from 19891.99 to 3128.89. Technical resistance levels include the 9427.66, 9816.32, and 9887.63 areas while technical support levels include the 8702.67 and 8587.98 areas.
Price activity is nearest the 50-bar MA (4-hourly) at 8,944.00 and the 100-bar MA (Hourly) at 9,316.27.
Technical Support is expected around 8156.16/ 7662.03/ 7568.45 with Stops expected below.
Technical Resistance is expected around 9593.07/ 9757.64/ 9963.74 with Stops expected above.
On 4-Hourly chart, SlowK is Bullishly above SlowD while MACD is Bullishly above MACDAverage.
On 60-minute chart, SlowK is Bearishly below SlowD while MACD is Bullishly above MACDAverage.
Ethereum (ETH/USD) appreciated early in today’s Asian session as the pair climbed to the 182.40 area during yesterday’s North American session. The pair has recently traded above the 170.00 level for the third time this year as traders have pushed the pair closer to the 175.00 area, an area the market traded above on 18 January when it escalated to the 179.32 area. During a subsequent pullback after trading above the 179.00 level, bids emerged around the 154.48 area and they led to the recent move back above the 170.00 area. Given the pair’s recent moves above the 170.00 area, the market has twice tested the 173.46 area, representing the 76.4% retracement of the move from 179.32 to 154.48.
Recent upside price gains have shifted the focus to areas of previous technical resistance that the market has moved through including the 179.85 area that represents the 76.4% retracement of the 199.50 – 116.25 range. Traders recently pushed the pair above the 170.30 area, representing the 50% retracement of the 224.34 – 116.25 range, and the next upside retracement level in this range is the 183.05 area. Also, the 177.85 area is the 50% retracement of the 239.35 – 116.25 range, and the 174.83 area is the 23.6% retracement of the 364.49 – 116.25 range. Technical resistance levels include the 177.90 and 183.05 areas while technical support levels include the 169.05 and 166.27 areas.
Price activity is nearest the 50-bar MA (4-hourly) at 171.29 and the 50-bar MA (Hourly) at 181.16.
Technical Support is expected around 170.00/ 164.89/ 156.47 with Stops expected below.
Technical Resistance is expected around 188.96/ 206.68/ 225.78 with Stops expected above.
On 4-Hourly chart, SlowK is Bullishly above SlowD while MACD is Bearishly below MACDAverage.
On 60-minute chart, SlowK is Bearishly below SlowD while MACD is Bullishly above MACDAverage.
Investment Disclaimer