Published
4 years ago on
February 18, 2020
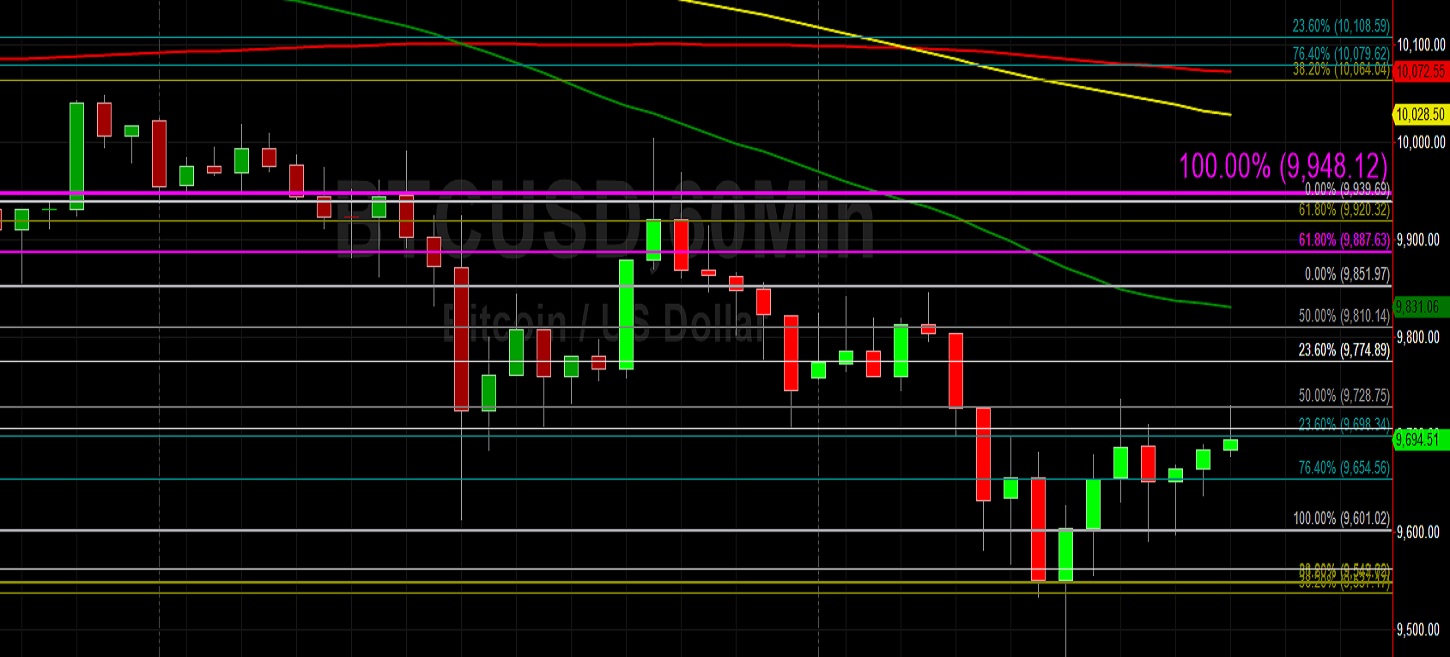
Bitcoin (BTC/USD) notched some gains early in today’s Asian session as the pair traded as high as the 9729.73 level after trading as low as the 9467.00 area during yesterday’s North American session. Traders pushed the pair to the 10004.63 level during yesterday’s Asian session before selling pressure emerged to knock the pair back below the 9500.00 level. The pair’s pullback below the psychologically-important 10000 figure late last week shifted some market bias, with some traders expecting the market could enter a period of consolidation. The inability of BTC/USD to pierce the psychologically-important 11000 figure shifted some market sentiment to become more neutral. The market will need to reclaim the upside price objectives that it soared past if it will reclaim its upside trajectory, and these include the 10083, 10167, 10215, and 10397 areas among many others.
Chartists have paid very close attention to the pair’s recent peak around the 10522.51 area, a fresh multi-month high, and this level was reached after traders elected Stops above the 10513.53 area during the move higher. Stops were elected below the 10239.21, 10017.50, and 9795.79 areas during the pair’s pullback, levels that technically relate to the 10513.53 upside price objective. Following the pair’s recent pullback, traders anticipate some potential buying pressure around price objectives that represented upside targets during the pair’s climb. These areas include the 9370, 9303, and 9203 levels.
Price activity is nearest the 100-bar MA (4-hourly) at 9806.74 and the 50-bar MA (Hourly) at 9830.74.
Technical Support is expected around 9370.10/ 9121.40/ 8760.28 with Stops expected below.
Technical Resistance is expected around 10534.04/ 10652.04/ 10698.24 with Stops expected above.
On 4-Hourly chart, SlowK is Bullishly above SlowD while MACD is Bearishly below MACDAverage.
On 60-minute chart, SlowK is Bullishly above SlowD while MACD is Bullishly above MACDAverage.
Ethereum (ETH/USD) appreciated early in today’s Asian session as the pair traded as high as the 262.74 level after trading as low as the 242.36 area during yesterday’s Asian session. Traders pushed the pair as high as the 290.00 area late last week, a new multi-month high dating to July last year, before traders booked profits and knocked the pair lower. It is challenging to evaluate whether the move lower represented a reassessment of market sentiment or whether traders were simply booking profits by exiting long positions. It is possible the market will consolidate for a period before traders take another run at crossing the psychologically-important 300.00 figure.
Some important technical clues emerged during the pair’s pullback away from the 290.00 level late last week. Bids emerged just below the 261.68 area during the pair’s move lower, a level that represents the 23.6% retracement of the move from 170.00 to 290.00. Below that area, additional areas of potential technical support include upside price objectives that the market moved through during its ascent. These levels include the 239.64 and 230.84 levels. Another major level is the 249.90 area, one that Stops were elected above during the push higher as it represents the 76.4% retracement of the depreciation from the 302.20 level to the 80.60 area.
Price activity is nearest the 50-bar MA (4-hourly) at 253.82 and the 50-bar MA (Hourly) at 259.16.
Technical Support is expected around 230.27/ 226.38/ 222.73 with Stops expected below.
Technical Resistance is expected around 296.15/ 304.10/ 312.93 with Stops expected above.
On 4-Hourly chart, SlowK is Bullishly above SlowD while MACD is Bearishly below MACDAverage.
On 60-minute chart, SlowK is Bullishly above SlowD while MACD is Bullishly above MACDAverage.
Investment Disclaimer