Published
4 years ago on
February 17, 2020
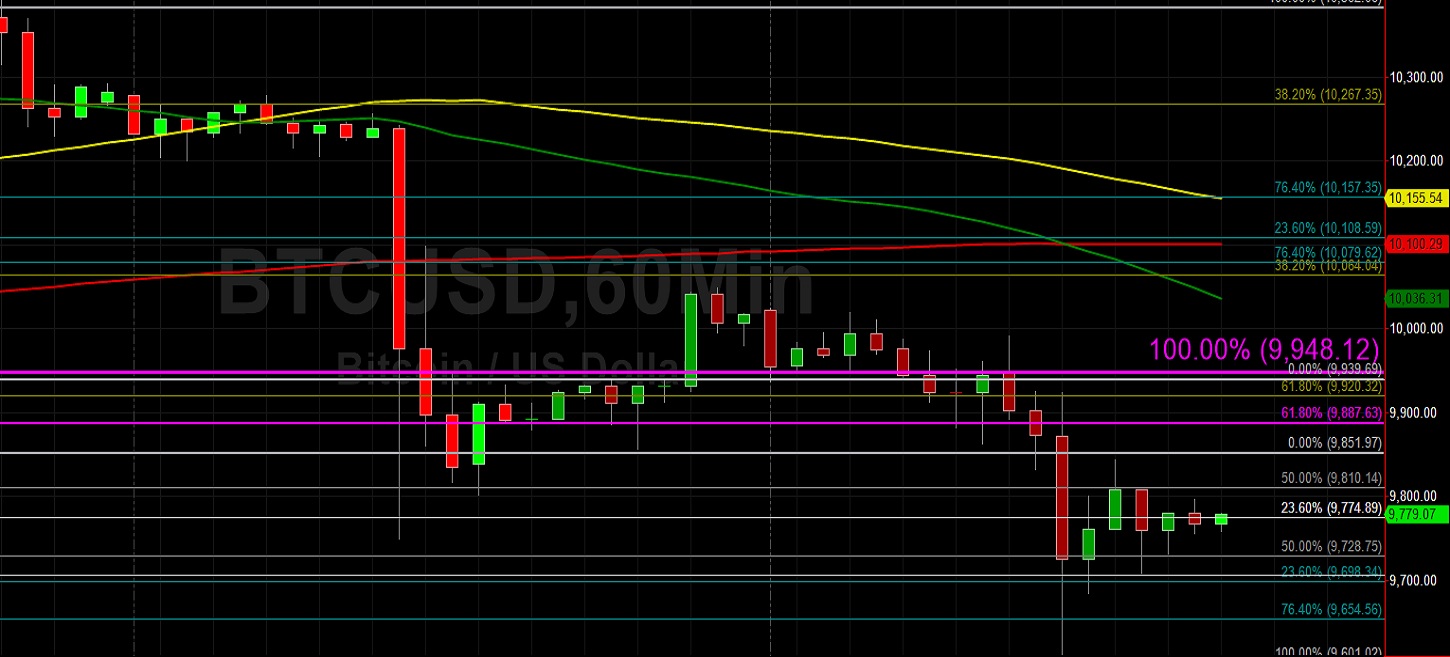
Bitcoin (BTC/USD) appreciated early in today’s Asian session as the pair climbed to the 9797.18 level after trading as low as the 9612.12 area during yesterday’s North American session. The pair peaked around the 10048.34 level during yesterday’s Asian session, down from the 10400.00 level area during Saturday’s Asian session. Market sentiment remains bullish for many traders as the pair has recently traded above the psychologically-important 10000 figure, but BTC/USD’s ability to score additional gains above this area is being closely evaluated to determine if the recent climb has staying power and sustainability. The market’s most immediate barometer of upside market strength will be its ability to test and move through upside price objectives. One such upside price objective that is technically significant is the 10615.81 area, a level that gained importance after buying pressure emerged around the 7723 area following the base of buying pressure that became evident around the 6430 area.
Another important upside price objective is the 10722.86 area, a level that gained technical significance after bids emerged around the 9078.05 area following the base of buying pressure that emerged around the 6430 level. A range of upside price objectives include the 10615, 10698, 10722, 10839, 10956, 11036, 11108, 11147, 11263, 11355, and 11393 areas, among many others. Below current market levels, there are a range of potential areas of technical support and these include the 9629 and 9565 levels. Chartists are closely watching price activity relative to the 50-bar MA (4-hourly) and 100-bar MA (4-hourly), given BTC/USD’s recent trading behaviour between these indicators.
Price activity is nearest the 100-bar MA (4-hourly) at 9786.00 and the 50-bar MA (Hourly) at 10036.02.
Technical Support is expected around 9370.10/ 9203.36/ 9078.05 with Stops expected below.
Technical Resistance is expected around 10534.04/ 10652.04/ 10698.24 with Stops expected above.
On 4-Hourly chart, SlowK is Bearishly below SlowD while MACD is Bearishly below MACDAverage.
On 60-minute chart, SlowK is Bearishly below SlowD while MACD is Bearishly below MACDAverage.
Ethereum (ETH/USD) appreciated early in today’s Asian session as the pair reclaimed some lost ground to the 254.44 area after trading as low as the 236.37 area during yesterday’s North American session. Earlier, the pair had traded as high as the 273.85 level during yesterday’s European session and as high as the 290.00 area during Saturday’s Asian session. Market sentiment has been quite bullish recently following the pair’s strong climb this month above the psychologically-important 200.00 and 250.00 levels to its recent high around the 290.00 area, its strongest print in several months. One of the most pressing questions facing chartists and traders is whether ETH/USD will be able to capitalise on this upside momentum and bullish sentiment and test the psychologically-important 300.00 figure.
Before it can test the 300.00 figure, however, traders must lift the pair through a flurry of potential technical resistance around some upside price objectives. These include the 290.32 and 294.43 areas, both of which correlate to buying pressure that emerged around the 184.29 area following initial bids that emerged around the 116.25 area. Another upside price objective where some technical resistance could mount is the 293.24 area, a level that became technically significant when some initial bids emerged around the 122.15 level followed by later buying pressure around the 175 area. Additional upside price objectives include the 294.30 and 296.15 levels.
Price activity is nearest the 50-bar MA (4-hourly) at 251.07 and the 200-bar MA (Hourly) at 250.46.
Technical Support is expected around 230.27/ 226.38/ 222.73 with Stops expected below.
Technical Resistance is expected around 281.03/ 296.15/ 304.10 with Stops expected above.
On 4-Hourly chart, SlowK is Bullishly above SlowD while MACD is Bearishly below MACDAverage.
On 60-minute chart, SlowK is Bullishly above SlowD while MACD is Bearishly below MACDAverage.
Investment Disclaimer