Published
4 years ago on
February 16, 2020
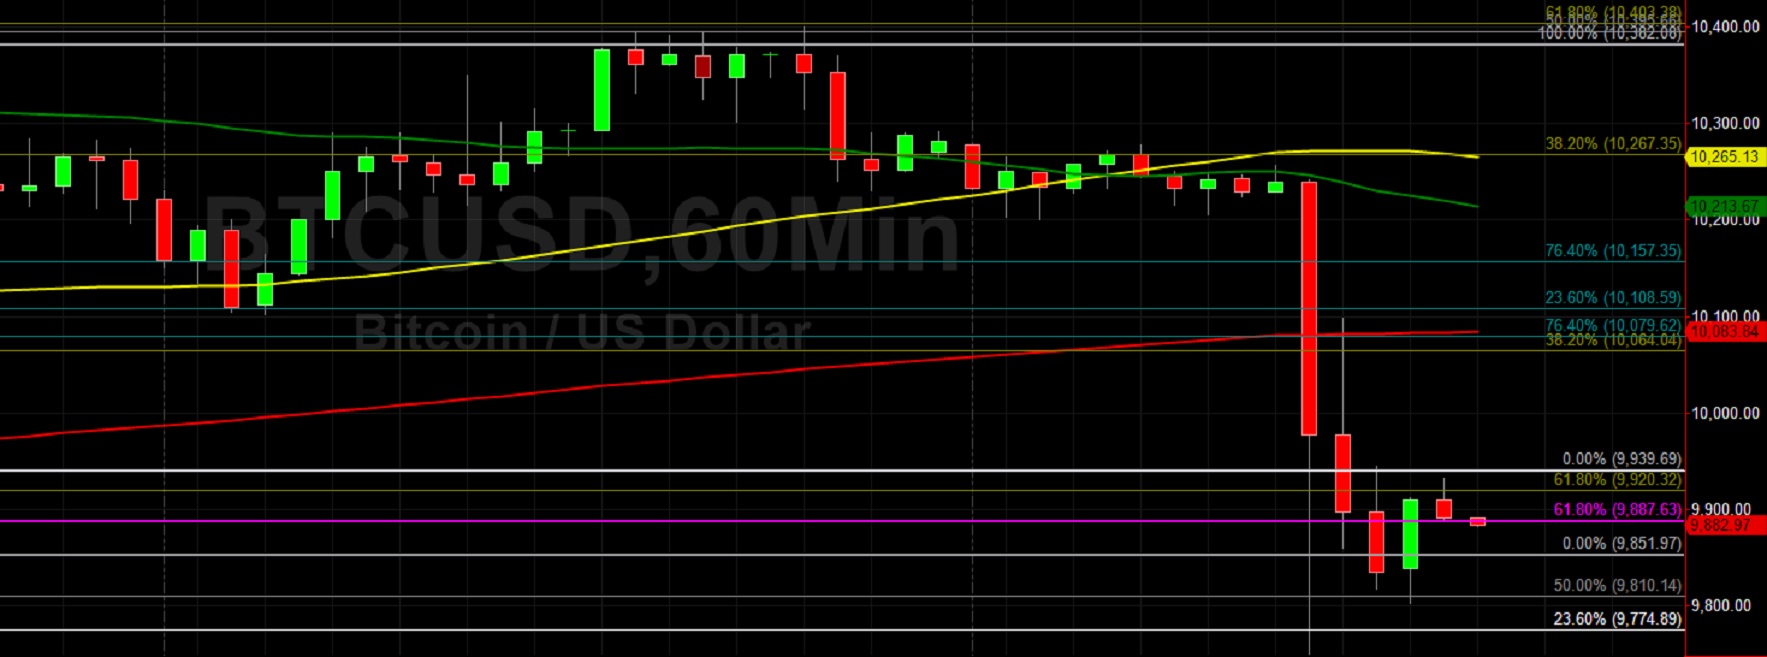
Bitcoin (BTC/USD) appreciated early in today’s Asian session as the pair gained ground to the 9945.00 area after being driven lower to the 9750.00 area during yesterday’s North American session. Stops were triggered below the 9978.34 area during the move lower, representing the 23.6% retracement of the appreciation from 8216.71 to 10522.51, with more triggered below the 9849.55 area, representing the 23.6% retracement of the 6430.00 – 10522.51 range. After trading above the 10500 level last week, the pair depreciated back below the 10200 area as traders booked profits, leading to some additional speculation the pair might be unable to sustain its recent surge above the psychologically-important 10000 figure. Upside price objectives that BTC/USD moved above will be closely watched during pullbacks below current market levels.
These areas of potential technical support include the 10104, 10060, 10017, 9983, 9961, 9945, 9716, 9629, and 9565 levels, among many others. Another technically significant area of potential support is the 9596.92 area, representing the 76.4% retracement of the 10545.53 – 6526.00 range. Above current market levels, traders will continue to pay close attention to upside price objectives that BTC/USD could test. These levels include 10615, 10698, 10722, 10839, 10956, 11036, 11108, 11147, 11263, 11355, and 11393, among many others. Stops are anticipated above most of these levels, as some momentum traders will seek to capture some of the market’s upside once these levels are penetrated. The market’s recent technical support around the 9706 level has deepened the amount of upside price objectives.
Price activity is nearest the 100-bar MA (4-hourly) at 9755.10 and the 200-bar MA (Hourly) at 10083.16.
Technical Support is expected around 9370.10/ 9121.40/ 8760.28 with Stops expected below.
Technical Resistance is expected around 10534.04/ 10652.04/ 10698.24 with Stops expected above.
On 4-Hourly chart, SlowK is Bearishly below SlowD while MACD is Bearishly below MACDAverage.
On 60-minute chart, SlowK is Bearishly below SlowD while MACD is Bearishly below MACDAverage.
Ethereum (ETH/USD) appreciated early in today’s Asian session as the pair appreciated to the 270.13 level after trading as low as the 261.35 area during yesterday’s North American session. The pair traded around the 290.00 area during yesterday’s Asian session, a fresh multi-month high, before ceding ground. During Friday’s European session, the pair retreated as low as the 260.13 level with some traders speculating the pair may face additional selling pressure and move back below the psychologically-important 250.00 figure. Upside price objectives that ETH/USD moved above will be closely monitored during pullbacks below current market activity. These areas of potential technical support include the 257, 253, 250, 247, 241, 240, 234, 230, 228, 226, and 222 levels, among many others.
One area of potential technical support that traders will closely watch is the 249.73 area, representing the 23.6% retracement of the move from 158.17 to 278.01. Above current market levels, there are many upside price objectives that traders may test if ETH/USD extends its recent surge higher towards the psychologically-important 300.00 figure. These levels include the 279, 285, 290, 293, 294, 304, 306, 313, and 315 areas among many others, and some of them were reached during the recent uptrend. The pair’s recent technical support around the 253.75 and 260.13 areas has increased the number of upside price objectives.
Price activity is nearest the 50-bar MA (4-hourly) at 245.68 and the 100-bar MA (Hourly) at 266.46.
Technical Support is expected around 230.27/ 226.38/ 222.73 with Stops expected below.
Technical Resistance is expected around 296.15/ 304.10/ 312.93 with Stops expected above.
On 4-Hourly chart, SlowK is Bearishly below SlowD while MACD is Bearishly below MACDAverage.
On 60-minute chart, SlowK is Bullishly above SlowD while MACD is Bearishly below MACDAverage.
Investment Disclaimer