Published
4 years ago on
February 10, 2020
Bitcoin
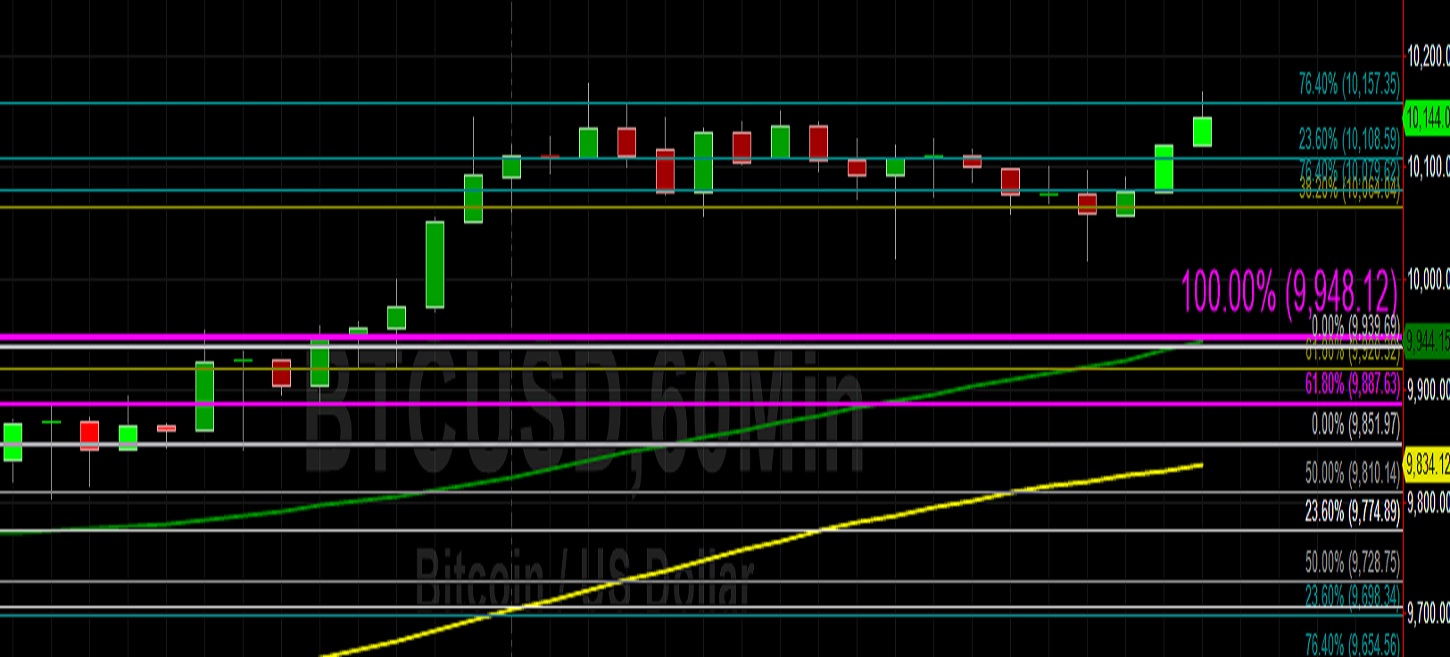
Bitcoin (BTC/USD) appreciated early in today’s Asian session as the pair traded as high as the 10119.99 area during yesterday’s North American session after having traded as high as the 10175.58 area during yesterday’s European session. These levels represent multi-month highs and traders are curious to see how much traction the pair can gain above the psychologically-important 10000 figure. Traders are evaluating the pair’s recent performance relative to some very important technical ranges including the depreciation from 13202.63 to 6430.00. Price activity has recently been traded above the 9816.32 area, representing the 50% retracement of this range, and the next upside retracement level in this range is the 10615.49 area.
Another very important range is the move from 3128.89 to 13868.44, and price activity has also recently traded above the 9765.93 area, representing the 38.2% retracement of this range. The next upside retracement level in this range is the 10615.49 area. Another very important range that traders continue to monitor is the depreciation from 19891.99 to 3128.89. Price activity recently moved above the 9532.39 area, representing the 38.2% retracement of this range, and the next upside retracement level in this range is the 11510.44 area, representing the 50% retracement. Above current market activity, price objectives include the 10215, 10234, 10239, and 10313 levels with Stops likely in place above these important levels.
Price activity is nearest the 50-bar MA (4-hourly) at 9588.35 and the 50-bar MA (Hourly) at 9444.01.
Technical Support is expected around 9948.51/ 9757.64/ 9370.10 with Stops expected below.
Technical Resistance is expected around 10215.41/ 10239.21/ 10313.70 with Stops expected above.
On 4-Hourly chart, SlowK is Bearishly below SlowD while MACD is Bullishly above MACDAverage.
On 60-minute chart, SlowK is Bullishly above SlowD while MACD is Bearishly below MACDAverage.
Ethereum
Ethereum (ETH/USD) appreciated early in today’s Asian session as the pair tested the 228.77 level after having traded as high as the 230.90 level during yesterday’s European session. Traders are comparing the pair’s recent trading activity relative to some important technical ranges. One important technical range is the depreciation from 239.35 to 116.25, and trading activity has recently traded above the 210.37 area, representing the 76.4% retracement of this range. Another very important technical range is the broader depreciation from 318.60 to 116.25, and the 217.43 area is the 50% retracement of this range, above which Stops were recently elected.
Additional Stops have recently been executed above the 211.08 area, representing the 38.2% retracement of the move from 364.49 to 116.25, and the next upside retracement level in this range is the 240.37 area. Also, another important technical range is the broader depreciation from 547.57 to 80.60, and the 190.94 level represents the 23.6% retracement of this range. The next upside retracement level in this range is the 259.09 area. Above current market activity, upside price objectives include the 230.55, 232.54, and 234.12 areas. Some selling pressure is likely in place around the 236.90 and 240.01 levels.
Price activity is nearest the 50-bar MA (4-hourly) at 204.93 and the 50-bar MA (Hourly) at 225.22.
Technical Support is expected around 195.32/ 183.33/ 170.00 with Stops expected below.
Technical Resistance is expected around 229.46/ 236.90/ 243.62 with Stops expected above.
On 4-Hourly chart, SlowK is Bearishly below SlowD while MACD is Bearishly below MACDAverage.
On 60-minute chart, SlowK is Bullishly above SlowD while MACD is Bearishly below MACDAverage.
Investment Disclaimer