Published
4 years ago on
March 01, 2020
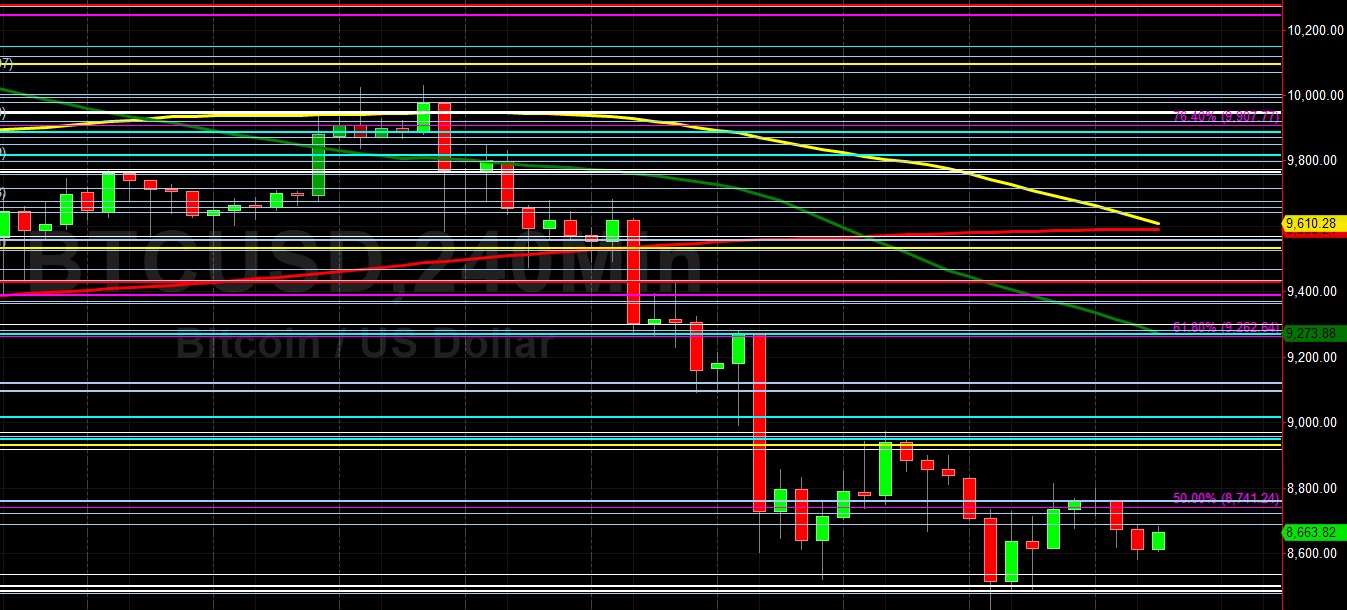
Bitcoin (BTC/USD) gained ground early in today’s Asian session as the pair traded as high as the 8683.95 area after trading as low as the 8580.96 area during yesterday’s European session. The pair recently has traded as low as the 8428.80 area during Friday’s European session and as high as the 8813.12 level during yesterday’s Asian session. The market concluded the final week of February on a weak note, having given back significant market capitalisation to conclude the month with an overall 7.9% loss. During last Wednesday’s price activity, significant Stops were elected below the 8722.49 area, a downside price objective related to the recent relative high around the 10400.00 level and subsequent selling pressure around the 10004.10 area.
The Stops that were elected pushed the pair as low as the 8520.00 area, the pair’s weakest print since late January. Traders continue to speculate where a bottom may be in the market given the recent deterioration in market sentiment. Some traders anticipate the market may remain above the 8476.26 area, a level that represents the 50% retracement of the move from 6430.00 to 10522.51. If the market continues to fade, some additional areas of downside technical support that traders are watching include the 8255.78, 7720.28, and 7305.83 areas. Stops are cited below the 8216.71 and 7671.00 areas, with additional Stops expected below the 6854.67 levels.
Price activity is nearest the 50-bar MA (4-hourly) at 9273.79 and the 50-bar MA (Hourly) at 8714.50.
Technical Support is expected around 8428.80/ 8062.25/ 7963.25 with Stops expected below.
Technical Resistance is expected around 9121.40/ 9370.00/ 10534.04 with Stops expected above.
On 4-Hourly chart, SlowK is Bearishly below SlowD while MACD is Bullishly above MACDAverage.
On 60-minute chart, SlowK is Bullishly above SlowD while MACD is Bearishly below MACDAverage.
Ethereum (ETH/USD) appreciated early in today’s Asian session as the pair traded as high as the 226.17 level after trading as low as the 221.15 area during yesterday’s North American session. The pair recently traded as low as the 213.63 area during Friday’s European session and as high as the 223.32 area during yesterday’s European session. Trading activity finished the last week of the month of February on a weak note after having traded as low as the 209.26 level, following its recent depreciation from the 278.13 level. Despite this recent pullback in price activity, ETH/USD still managed to notch a 24.3% gain in February. The market’s biggest technical clue last week was seen when buying pressure finally emerged around the 209.26 level, just below the 209.75 area that represents the 23.6% retracement of the move from 627.83 to 80.60.
This was a level that had not traded since early February. The recent sizable sell-off in ETH/USD has many speculators contemplating how low the market could get before market sentiment improves and a positive trading bias returns to the market. Below the market’s recent low, the 208.53 and 206.25 levels are important areas of potential technical support. Another very important level is the 203.13 area, a level that represents the 50% retracement of the appreciation from the 116.25 area to 290.00 level. Below that area, additional levels of possible technical support include the 194.28, 189.28, 186.46, and 184.29 levels.
Price activity is nearest the 200-bar MA (4-hourly) at 229.96 and the 50-bar MA (Hourly) at 226.42.
Technical Support is expected around 209.25/ 203.25/ 192.10 with Stops expected below.
Technical Resistance is expected around 253.75/ 260.41/ 270.09 with Stops expected above.
On 4-Hourly chart, SlowK is Bearishly below SlowD while MACD is Bullishly above MACDAverage.
On 60-minute chart, SlowK is Bullishly above SlowD while MACD is Bearishly below MACDAverage.
Investment Disclaimer