Published
4 years ago on
January 04, 2020
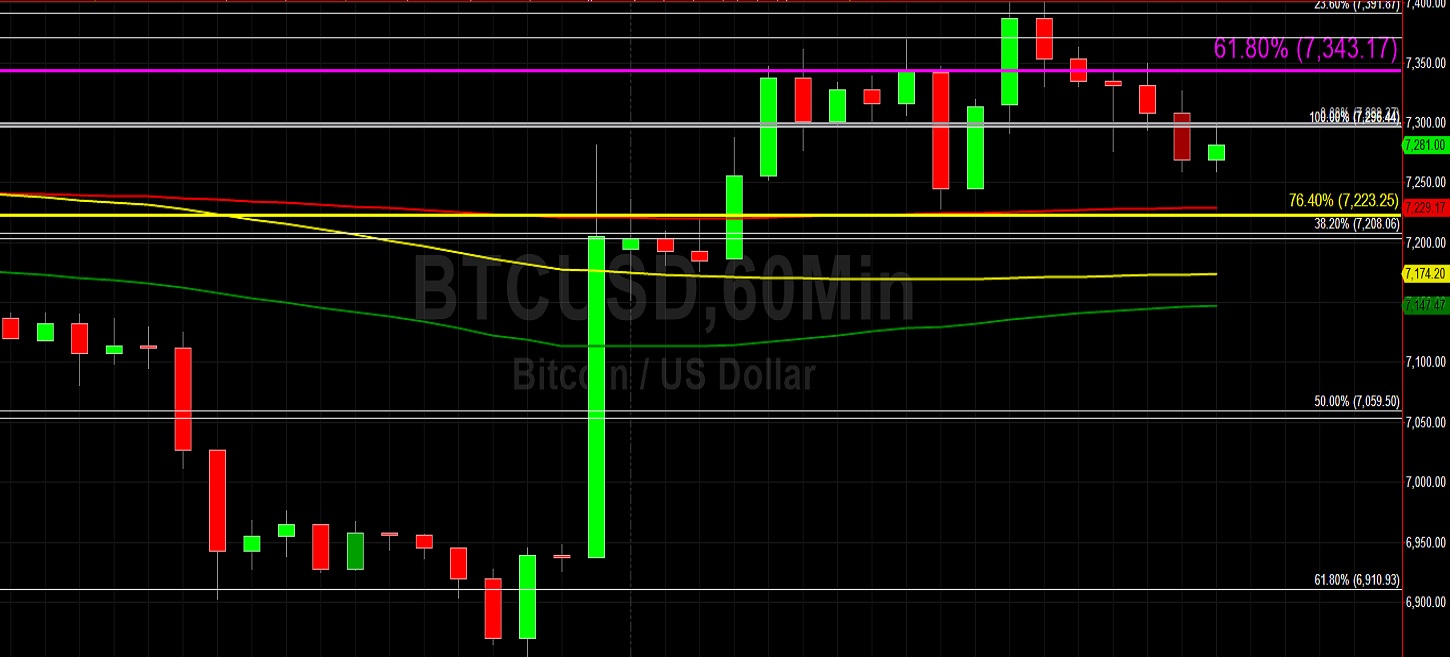
Bitcoin (BTC/USD) faded early in today’s Asian session as the pair pared back to the 7259.00 level after trading as high as the 7401.20 area during yesterday’s North American session. Earlier, the pair was trading around the 6841.36 level, representing the 76.4% retracement of the move from 4670.69 to 13868.44. The pair has been confined to a relatively narrow range for several weeks as traders have generally kept the pair between the 6430 and 7870 levels. Prior to this range beginning in late November, BTC/USD had generally been a one-way trade since late-October when the pair peaked around the 10540.49 area. Traders awaiting a market breakout are split as to whether any such breakout will be higher or lower, and this reflects the lack of new market sentiment strong enough to decisively push the market in one direction or another.
Traders who anticipate a stronger BTC/USD are contemplating upside price objectives including the 8062, 8181, 8338, 8535, 8735, 8948, and 9301 levels. The technical relevance of some of these price levels was reconfirmed in November as the pair drifted lower from the 10540.49 late-October high. Traders anticipate some Stops above the 7722 and 8059 levels. Traders who anticipate a weaker BTC/USD are contemplating downside price objectives including the 6910, 6727, 6526, 6430, and 6323 levels. Traders anticipate some Stops below the 6038 area.
Price activity is nearest the 50-bar MA (4-hourly) at 7,232.51 and the 200-bar MA (Hourly) at 7,229.14.
Technical Support is expected around 6526.00/ 6323.42/ 5941.26 with Stops expected below.
Technical Resistance is expected around 7870.10/ 7927.23/ 8338.78 with Stops expected above.
On 4-Hourly chart, SlowK is Bearishly below SlowD while MACD is Bullishly above MACDAverage.
On 60-minute chart, SlowK is Bearishly below SlowD while MACD is Bearishly below MACDAverage.
Ethereum (ETH/USD) came off early in today’s Asian session as the pair weakened to the 131.00 figure after trading as high as the 134.93 area during yesterday’s North American session. The pair was earlier trading around the 125.52 area during yesterday’s Asian session before escalating higher. Traders have generally kept the pair trading between a 116.25 – 135.24 range since 18 December, after the pair weakened from the 157.73 area in late November. Prior to that, the pair weakened from the 199.50 level in late October and the 224.34 area in late September. In fact, the pair has steadily eroded in value after plateauing around the 364.43 area in late June. Traders are split as to whether the pair’s next decisive move will be higher or lower.
ETH/USD Bulls anticipating a move higher are looking at upside price targets including 136.99, 141.88, 147.94, and 157.73 areas with some Stops anticipated above some of those areas. The 50-bar MA (4-hourly) and 100-bar MA (4-hourly) has bullishly converged, and ETH/USD Bulls may be aided by this development. ETH/USD Bears anticipating a move lower are looking at some downside price targets including 124.50, 121.35, and 116.25 with some larger Stops anticipated below the 116.25 level. Very bearish traders and chartists are also keeping their eyes on the 104.77 level.
Price activity is nearest the 50-bar MA (4-hourly) at 129.61 and the 100-bar MA (Hourly) at 130.14.
Technical Support is expected around 119.50/ 115.60/ 111.17 with Stops expected below.
Technical Resistance is expected around 137.61/ 141.74/ 146.00 with Stops expected above.
On 4-Hourly chart, SlowK is Bearishly below SlowD while MACD is Bullishly above MACDAverage.
On 60-minute chart, SlowK is Bearishly below SlowD while MACD is Bearishly below MACDAverage.
Investment Disclaimer