Published
4 years ago on
January 28, 2020
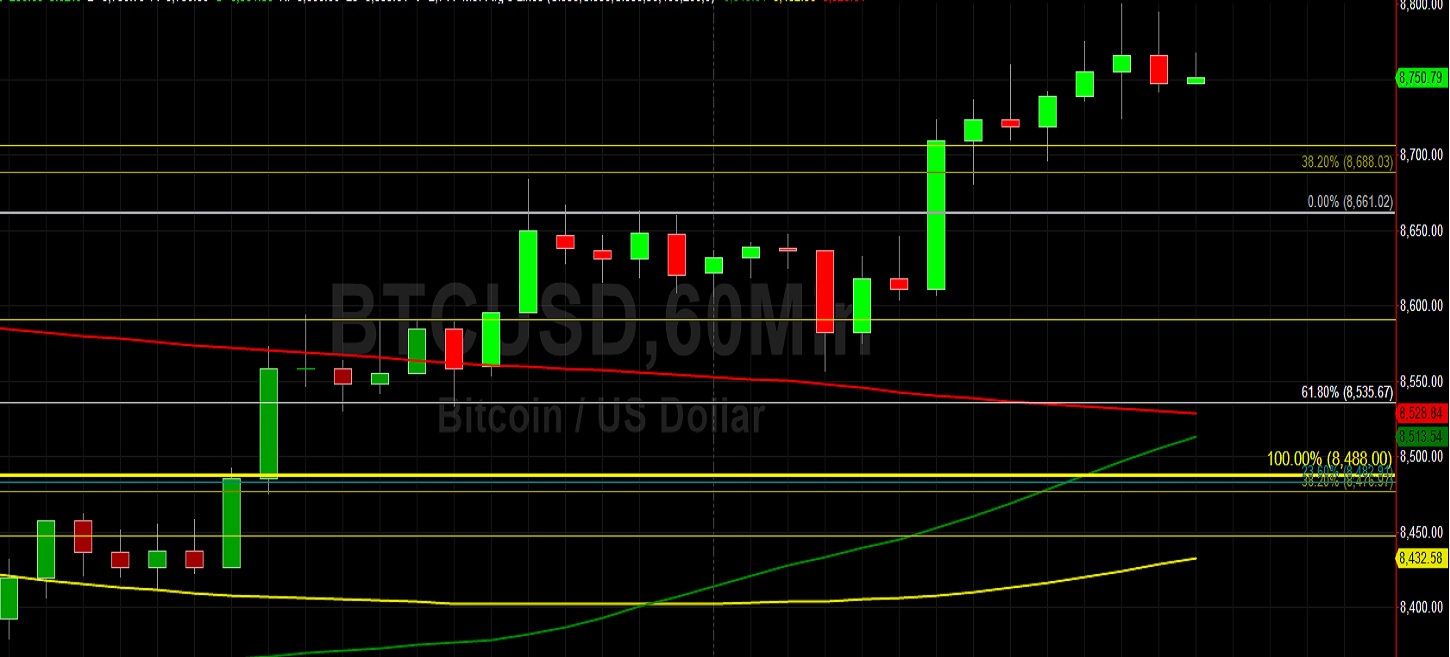
Bitcoin (BTC/USD) gave back some gains early in today’s Asian session as the pair fell to the 8742.16 area after trading as high as the 8800.00 level during yesterday’s North American session. The pair had recently been orbiting the 8300.99 level, representing the 38.2% retracement of the appreciation from the 6854.67 level to the 9194.99 area. Some bids have recently emerged not too far below the 8253.16 level, representing the 61.8% retracement of the 7671.00 – 9194.99 range. Chartists have been paying close attention to a bearish convergence of the 100-bar MA (4-hourly) and the 50-bar MA (4-hourly) since BTC/USD dropped back below the 8800 area.
The pair depreciated from the 8500 area late last week and traded very technically during the pullback and subsequent retracement higher. Stops were elected below the 8309.19 area during the downturn, an exhaustion point related to a short-term trading pattern. Traders later lifted the pair back to just above the 8404.60 area, representing a 50% retracement of a projected downside range from the 8500 area. After that technically-significant level was reached, the market came off again to the 8278.68 area, just below the 8285.82 area that represents the 76.4% retracement of the recent appreciation from the 8216.71 area to the 8509.55 area.
Price activity is nearest the 100-bar MA (4-hourly) at 8,540.82 and the 200-bar MA (Hourly) at 8,528.88.
Technical Support is expected around 8156.16/ 7662.03/ 7568.45 with Stops expected below.
Technical Resistance is expected around 9194.99/ 9303.07/ 9593.07 with Stops expected above.
On 4-Hourly chart, SlowK is Bullishly above SlowD while MACD is Bullishly above MACDAverage.
On 60-minute chart, SlowK is Bearishly below SlowD while MACD is Bullishly above MACDAverage.
Ethereum (ETH/USD) gave back some recent gains early in today’s Asian session as the pair fell to the 169.12 level after trading as high as the 170.85 area during yesterday’s North American session. The pair has recently found some technical support around the 100-bar MA (4-hourly) following its recent move below the 50-bar MA (4-hourly), and chartists have observed that the pair has also recently been supported around the 157.22 area, other than a test of the 155.26 area that represents the 38.2% retracement of the move from 116.33 to 179.32. Chartists also observe that the pair is now trading above the 50-bar MA (hourly).
Some interesting short-term trading dynamics emerged late last week after the pair peaked at a relative high around the 163.77 area before depreciating. Stops were eventually elected below the 158.05 area during the move lower, representing an exhaustion point related to a short-term trading pattern. During the pair’s recovery and retracement higher, traders pushed the pair back to the 162.39 area, right around the 76.4% retracement of the move from 163.78 to 158.05. Selling pressure then pushed the pair lower to just below the 159.35 area, representing the 50% retracement of the move from 154.48 to 164.21. Below current price activity, technical support is expected around the 157.88 and 154.71 areas.
Price activity is nearest the 50-bar MA (4-hourly) at 164.37 and the 50-bar MA (Hourly) at 164.49.
Technical Support is expected around 156.47/ 153.07/ 147.83 with Stops expected below.
Technical Resistance is expected around 179.32/ 180.45/ 187.15 with Stops expected above.
On 4-Hourly chart, SlowK is Bullishly above SlowD while MACD is Bullishly above MACDAverage.
On 60-minute chart, SlowK is Bearishly below SlowD while MACD is Bullishly above MACDAverage.
Investment Disclaimer