Published
4 years ago on
January 25, 2020
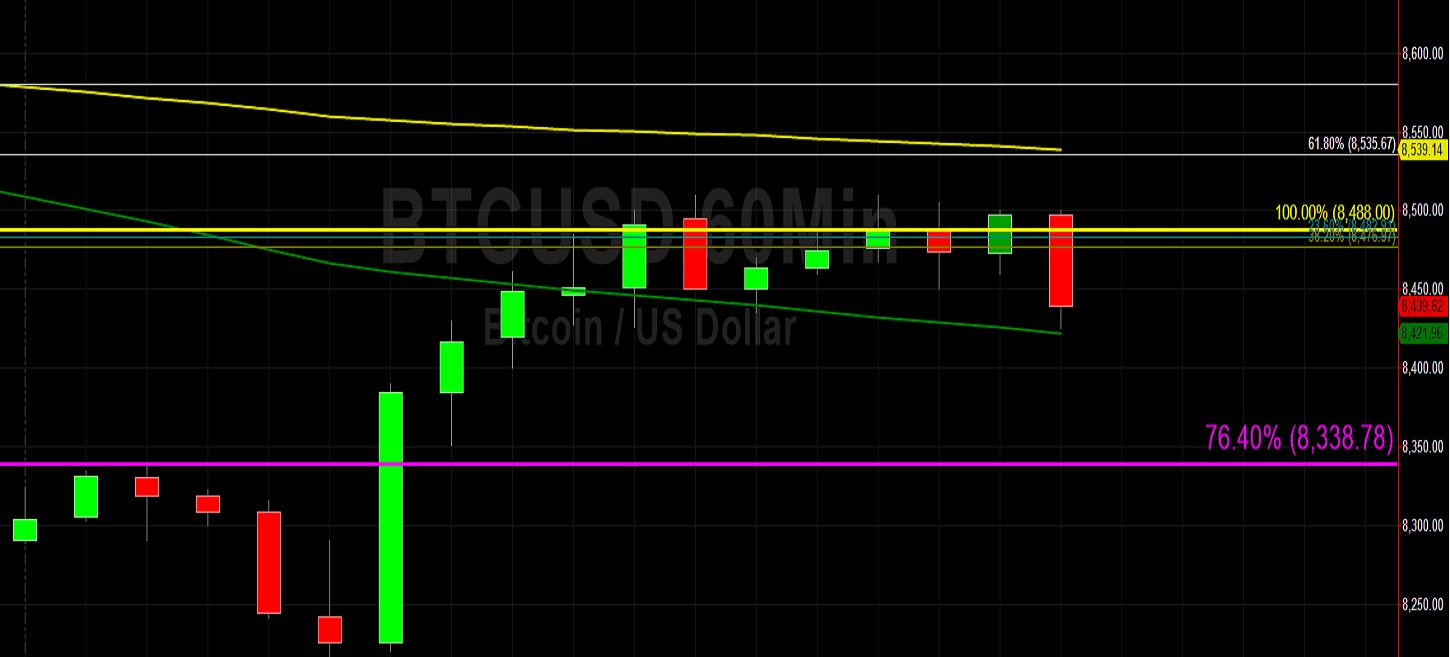
Bitcoin (BTC/USD) rallied early in today’s Asian session as the pair escalated higher to the 8500.00 figure after trading as low as the 8216.71 area during yesterday’s European session. Yesterday’s intraday low was right around the 8219.84 area that represents the 38.2% retracement of the move from 10950.57 to 6531.91. After testing the 8590.11 area on Thursday, the pair steadily declined to the 8278.00 area after Stops were elected below the 8338.78 area, representing the 76.4% retracement of the move from 9948.12 to 3128.89. Chartists have observed that the 200-bar MA (hourly) has recently bearishly moved above the 50-bar MA (hourly) and 100-bar MA (hourly), and that the 200-bar MA (hourly) has bearishly moved above the 100-bar MA (hourly). This has coincided with the depreciation of BTC/USD to its weakest level since 13 January 2020.
Chartists also note that the pair’s weakness late in the week saw it decline below the 100-bar MA (4-hourly) for the first time since 3 January, an indication of its recent strength above the psychologically-important 7000 and 8000 areas. Last weekend, the pair traded as high as the 9194.99 area but its inability to remain above the 9000 area saw Stops elected below the 8300.99 area, representing the 38.2% retracement of the 6854.67 – 9194.99 range. Below current market activity, technical support is expected around the 8292 and 8223 levels. Above current market activity, traders anticipate technical resistance around the 8923 and 9131 areas.
Price activity is nearest the 100-bar MA (4-hourly) at 8,453.20 and the 50-bar MA (Hourly) at 8,421.73.
Technical Support is expected around 8156.16/ 7662.03/ 7568.45 with Stops expected below.
Technical Resistance is expected around 9194.99/ 9303.07/ 9593.07 with Stops expected above.
On 4-Hourly chart, SlowK is Bullishly above SlowD while MACD is Bullishly above MACDAverage.
On 60-minute chart, SlowK is Bearishly below SlowD while MACD is Bullishly above MACDAverage.
Ethereum (ETH/USD) gained some ground early in today’s Asian session as the pair reached the 163.58 area after trading as low as the 154.48 area during yesterday’s European session, its weakest level since 14 January. Notably, this low was just below the 155.26 level that represents the 38.2% retracement of the move from 116.33 to 179.32. Upside price momentum stalled around the 171.05 area on Wednesday and then Stops were elected below the 160.71 area on Thursday, a level that represents the 50% retracement of the move from 142.10 to 179.32. The next downside level in this range is the 156.32 area and Stops are likely in place below this level. A broader range that traders are watching is the recent move from the 135.12 area to the 179.32 area, and an important level is the 157.22 area, representing the 50% retracement.
The 164.45 area is an important level that represents the 23.6% retracement of the broader range of the move from 116.33 to 179.32, and Stops were elected below this area on 19 January. The next downside level in this range is the 155.26 area, representing the 38.2% retracement and Stops are likely in place below this level. Chartists have noted that the 50-bar MA (hourly) has recently moved below the 100-bar MA (hourly), a bearish development that has coincided with market weakness. Below current price activity, technical support is expected around the 157.88 and 154.71 areas. Above current price activity, technical resistance is expected around the 177.11, 177.90, and 179.19 areas.
Price activity is nearest the 100-bar MA (4-hourly) at 156.05 and the 50-bar MA (Hourly) at 165.74.
Technical Support is expected around 156.47/ 153.07/ 147.83 with Stops expected below.
Technical Resistance is expected around 179.32/ 180.45/ 187.15 with Stops expected above.
On 4-Hourly chart, SlowK is Bullishly above SlowD while MACD is Bearishly below MACDAverage.
On 60-minute chart, SlowK is Bearishly below SlowD while MACD is Bullishly above MACDAverage.
Investment Disclaimer