
Published
4 years ago on
January 22, 2020
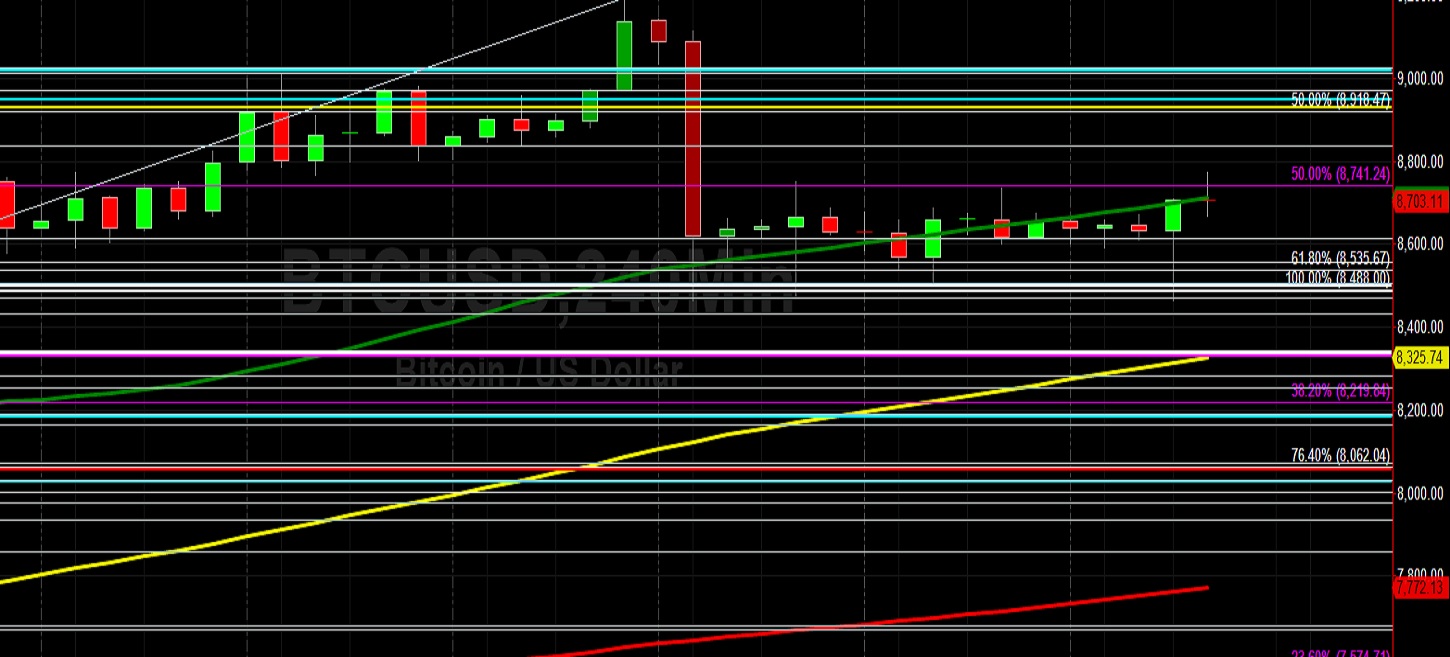
Bitcoin (BTC/USD) weakened early in today’s Asian session as the pair fell to the 8693.39 area following a late rally to the 8774.31 area during yesterday’s North American session that began earlier in the session around the 8465.00 area. Following the pair’s sharp decline over the weekend from the 9194.99 area to the 8465.00 level, BTC/USD has largely traded sideways, generally supported above the 8500.00 figure. During the weekend pullback, the pair remained bid above the 8433.00 area, representing the 50% retracement of the recent 7671.00 – 9194.99 range. Notably, selling pressure emerged around the 8741.24 area during the pair’s limited upside movements following that recent low, and that price level represents the 50% retracement of the 10950.57 – 6531.91 range.
BTC/USD’s inability to recently sustain gains above the psychologically-important 9000 figure could lead to weaker price activity in the short-term. The recent pullback has also seen the 50-bar MA (4-hourly) catch up with price activity, and traders will look to see if market sentiment strengthens or weakens from current price levels. Likewise, chartists have noticed that the 100-bar MA (hourly) has just bearishly crossed above the 50-bar MA (hourly), a bearish development that could lead to additional price depreciation. Likewise, the 100-bar MA (hourly) and 200-bar MA (hourly) are bearishly converging. Below current market activity, technical support is expected around the 8458, 8377, 8292, and 8223 levels. Above current market activity, traders anticipate technical resistance around the 8923 and 9131 areas.
Price activity is nearest the 50-bar MA (4-hourly) at 8,710.68 and the 200-bar MA (Hourly) at 8,708.51.
Technical Support is expected around 8338.78/ 7662.03/ 7568.45 with Stops expected below.
Technical Resistance is expected around 9194.99/ 9303.07/ 9593.07 with Stops expected above.
On 4-Hourly chart, SlowK is Bullishly above SlowD while MACD is Bearishly below MACDAverage.
On 60-minute chart, SlowK is Bullishly above SlowD while MACD is Bullishly above MACDAverage.
Ethereum (ETH/USD) slumped lower early in today’s Asian session as the pair receded to the 168.00 level during yesterday’s North American session after being capped around the 170.00 area earlier in the session. Upside price momentum emerged earlier in yesterday’s North American session around the 164.28 area. Chartists have noted that the pair continues to orbit the 167.80 area, representing the 50% retracement of the move from 255.00 to 80.60. Traders are curious to see if the pair can remain above the psychologically-important 150.00 figure following its recent climb to the 179.32 area. During the pair’s pullback, bids emerged around the 161.10 area, just above the 160.71 level that represents the 50% retracement of the recent move from 142.10 to 179.32.
Notably, this recent low is also around the area where the 50-bar MA (4-hourly) was indicating during the pullback. The next upside price retracement level in this range is the 165.10 area and the next downside level in this range is the 156.32 area. Chartists have noted that the 100-bar MA (hourly) has just crossed above the 50-bar MA (hourly), a bearish development that could coincide with downside price pressures. Additionally, traders note that technical support emerged just above the 200-bar MA (hourly) during the pair’s recent move to the 161.10 area. Another important range that traders are closely watching is the move from 135.12 to 179.32 and a couple of important levels in this range include the 157.22 and 162.44 levels. Below current price activity, technical support is expected around the 160.00, 157.88, and 154.71 areas. Above current price activity, technical resistance is expected around the 177.11, 177.90, and 179.19 areas.
Price activity is nearest the 50-bar MA (4-hourly) at 164.94 and the 100-bar MA (Hourly) at 168.82.
Technical Support is expected around 159.86/ 156.47/ 153.07 with Stops expected below.
Technical Resistance is expected around 179.32/ 180.45/ 187.15 with Stops expected above.
On 4-Hourly chart, SlowK is Bullishly above SlowD while MACD is Bearishly below MACDAverage.
On 60-minute chart, SlowK is Bullishly above SlowD while MACD is Bullishly above MACDAverage.
Investment Disclaimer


