Published
4 years ago on
January 21, 2020
Litecoin (LTC/USD) weakened early in today’s Asian session as the pair receded to the 57.12 level after being capped around the 58.19 area during yesterday’s North American session, a level that was right around the 50-bar MA (hourly) at the time. The pair’s recent climb has seen price activity recently hover around the psychologically-important 60.00 figure following a recent high print around the 63.17 level, right around the 38.2% retracement of the move from 107.04 to 35.88. Another important level that is impacting price is the depreciation from the 80.26 level to the 35.88 area. Bids recently emerged around the 58.07 level, representing the 50% retracement of this range, and this led to a move back above the 60.00 figure.
During the pair’s recent ascent from around the psychologically-important 50.00 figure, Stops were elected above the 54.61 level, representing the 61.8% retracement of the move from 66.19 to 35.88. Following the pair’s recent climb to the 63.17 area, a new series of levels has taken on greater technical importance including the 56.73 level, representing the 23.6% retracement of that range, followed by the 52.75 and 49.53 areas, representing the 38.2% and 50% retracements of the range. Chartists have noted that even though the pair has recently traded above the 50-bar MA (hourly), price activity has moved below and has recently tested the 100-bar MA (hourly).
Price activity is nearest the 50-bar MA (4-hourly) at 56.62 and the 200-bar MA (Hourly) at 56.56.
Technical Support is expected around 55.35/ 53.07/ 51.38 with Stops expected below.
Technical Resistance is expected around 60.68/ 61.93/ 63.06 with Stops expected above.
On 4-Hourly chart, SlowK is Bullishly above SlowD while MACD is Bearishly below MACDAverage.
On 60-minute chart, SlowK is Bearishly below SlowD while MACD is Bullishly above MACDAverage.
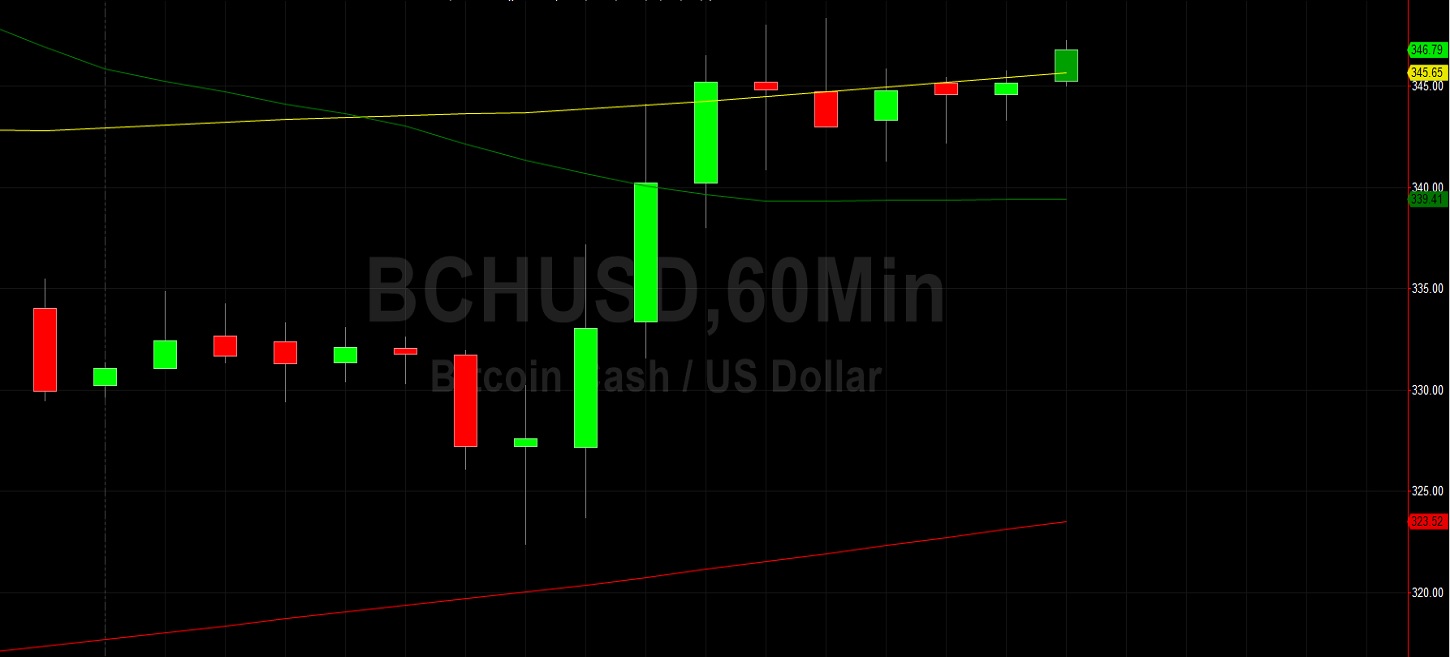
Bitcoin Cash (BCH/USD) gained slight around early in today’s Asian session as the pair was lifted to the 347.25 area after finding support around the 322.38 area during yesterday’s European session. The pair recently traded above the psychologically-important 400.00 figure for the first time since July as traders pushed the pair to the 405.00 area. Significant Stops were elected above the 384.92 area during the pair’s appreciation, representing the 61.8% retracement of the depreciation from 517.75 to 170.03. Major Stops were also triggered above additional levels during the pair’s ascent, including the 311.27, 323.04, and 363.69 areas, levels that represent upside price objectives related to the pair’s 2020 low around the 191.48 area.
The next upside level in that range is the 435.69 area and the next downside level in that range is the 343.89 area followed by the 302.86 area. Above recent price activity, BCH/USD bulls are monitoring some upside price objectives including the 412.84 and 422.88 areas. During any pullbacks lower, traders will look to see if buying pressure emerges around levels including the 315.24, 287.52, 259.79, and 255.48 areas. These levels represent retracement levels related to the recent appreciation from the 170.03 area to the 405.00 area.
Price activity is nearest the 50-bar MA (4-hourly) at 324.91 and the 100-bar MA (Hourly) at 345.65.
Technical Support is expected around 261.14/ 254.38/ 251.38 with Stops expected below.
Technical Resistance is expected around 365.70/ 405.00/ 422.88 with Stops expected above.
On 4-Hourly chart, SlowK is Bullishly above SlowD while MACD is Bearishly below MACDAverage.
On 60-minute chart, SlowK is Bullishly above SlowD while MACD is Bullishly above MACDAverage.
Investment Disclaimer