Published
4 years ago on
January 20, 2020
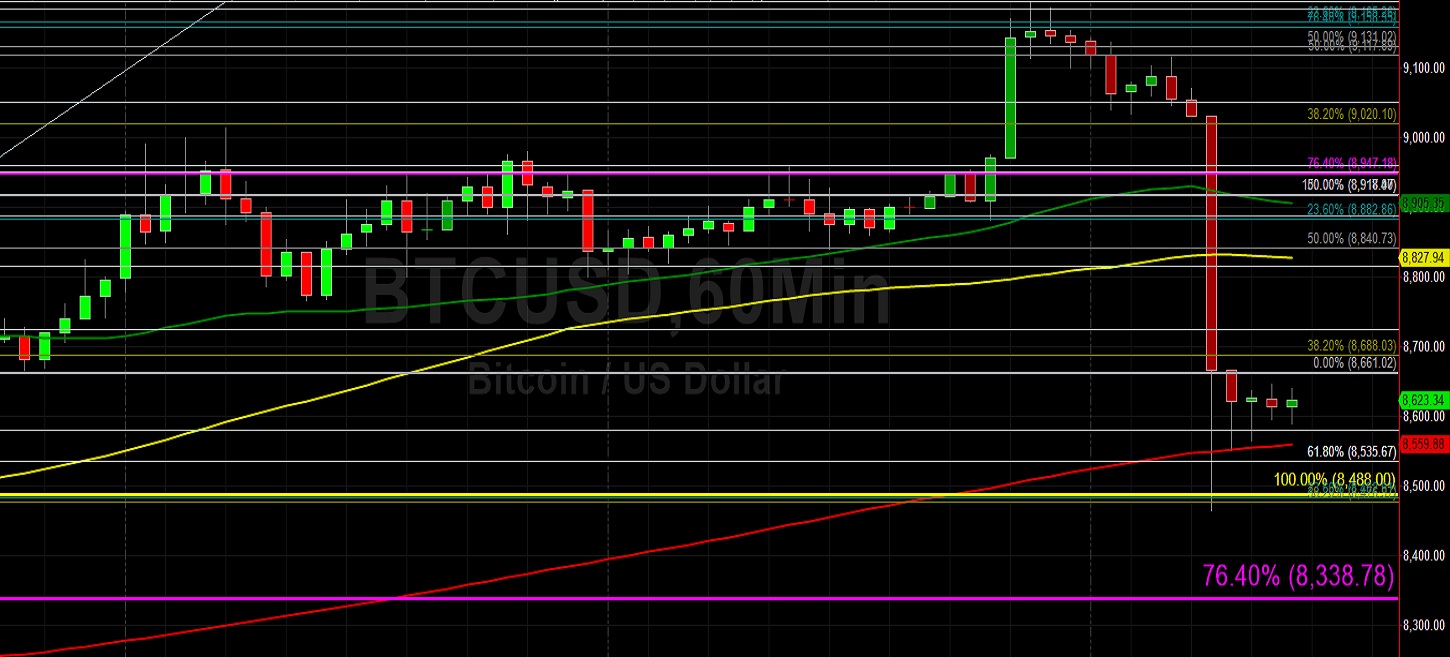
Bitcoin (BTC/USD) was still trying to recover early in today’s Asian session as the pair remained quite volatile following a rapid depreciation during yesterday’s European session that saw traders knock the pair as low as the 8465.00 area after trading as high as the 9194.99 area during yesterday’s Asian session. Traders had been awaiting clues that the pair may be emerging from the sideways trading pattern that it has experienced over the past couple of days, with bids generally keeping the pair above the 8765 level and offers generally keeping the pair below the 9015 level. Below current market activity, the 8784 area had provided some technical support over the past couple of days, an important level that represents the 23.6% retracement of the move from 8045.07 to 9013.00.
Above current market activity, price activity continues to be influenced by technical levels related to the depreciation from the 10540.49 area in late October, a recent relative high from which levels such as the 9010 and 9150 areas have gained technical significance as they represent downside price objectives from that level. The 9010 area has recently turned into technical resistance, limiting the pair’s recent movements above the psychologically-important 9000 figure. Likewise, the recent relative low around the 6430 area likely has resulted in selling pressure between the 9033 and 9071 levels and another recent low around the 7963.25 likely has resulted in selling pressure between the 9011 and 9047 areas.
Price activity is nearest the 50-bar MA (4-hourly) at 8,560.96 and the 200-bar MA (Hourly) at 8,559.92.
Technical Support is expected around 8338.78/ 7662.03/ 7568.45 with Stops expected below.
Technical Resistance is expected around 9194.99/ 9303.07/ 9593.07 with Stops expected above.
On 4-Hourly chart, SlowK is Bearishly below SlowD while MACD is Bearishly below MACDAverage.
On 60-minute chart, SlowK is Bearishly below SlowD while MACD is Bearishly below MACDAverage.
Ethereum (ETH/USD) remained volatile early in today’s Asian session as the pair tried to recover from its rapid pullback to the 161.70 area after peaking around the 177.14 area during yesterday’s European session. Stops were elected below the 171, 168, 166, and 163 areas during the sell-off. The pair reached its highest level since mid-November, printing early in the weekend around the 179.32 area after Stops were elected above the 177.85 area, a level that represents the 50% retracement of the move from 239.45 to 116.25. The next upside retracement level related to that range is the 192.39 area and the next downside retracement level related to that range is the 163.31 area. Another similar important level is the 183.05 area, representing the 61.8% retracement of the 224.34 – 116.25 range. The next upside retracement level related to that range is the 198.83 area and the next downside retracement level related to that range is the 170.30 area.
Another important recent range is the move from 158.17 to 179.32, and the recent upward price movements has chartists focusing on the 171, 168, 166, and 163 areas. Some additional levels that traders are monitoring include the 177.90 and 188.96 areas, levels related to the recent relative low around the 142.10 level. Additional technical levels related to that range include the 171.06, 167.31, and 165.53 areas. Also, the 164.70 area is another important level related to another recent relative low around the 135.12 level. Similarly, additional important price levels include the 164.00, 163.11, and 170.30 areas that represent retracement areas related to the depreciation from the 318.60, 239.45, and 224.34 levels. Following the pair’s recent strength, traders are now monitoring upside price objectives including the 174.20, 177.34, and 179.19 areas. Stops are cited above the 177.11 level.
Price activity is nearest the 50-bar MA (4-hourly) at 158.73 and the 100-bar MA (Hourly) at 168.13.
Technical Support is expected around 159.86/ 156.47/ 153.07 with Stops expected below.
Technical Resistance is expected around 179.32/ 180.45/ 187.15 with Stops expected above.
On 4-Hourly chart, SlowK is Bearishly below SlowD while MACD is Bearishly below MACDAverage.
On 60-minute chart, SlowK is Bearishly below SlowD while MACD is Bearishly below MACDAverage.
Investment Disclaimer