Published
4 years ago on
January 09, 2020
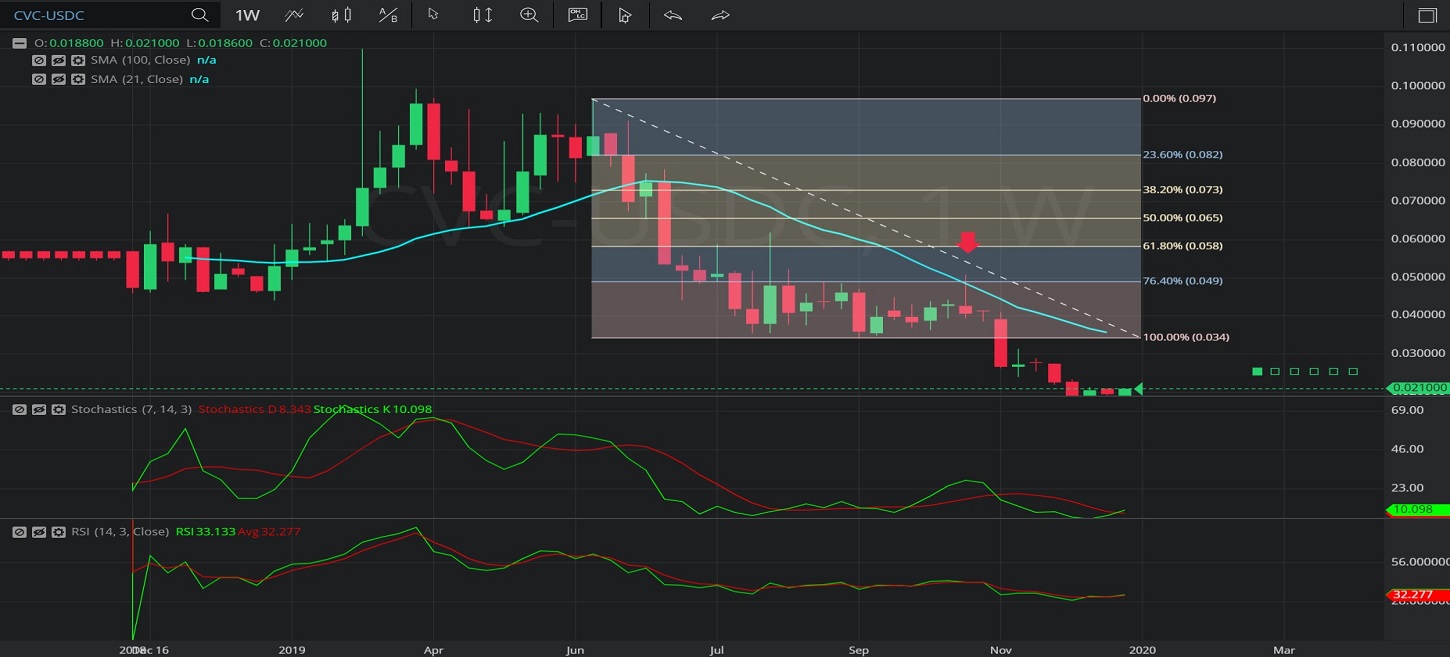
In this Weekly chart of Civic/ US dollar Coin (CVC/ USDC), there is a depreciating range from 0.096682 to 0.034445.
We can observe that the market then appreciated to the 0.051 level (identified by the red down arrow), just above the 0.04913293 level that represents the 23.6% retracement of the depreciating range.
We can observe that the 0.051 level was just above the 0.048366 level, the area where the 21-bar Simple Moving Average was indicating at the time.
The market then depreciated to the 0.017 level.
Using RSI, we can observe that the slope of RSI (14) turned negative after the market traded as high as the 0.051 level, and that RSI Average (3) bearishly crossed above RSI (14) thereafter. RSI (14) has since moved above RSI Average (3), suggesting a possible end to the depreciation.
Using Slow Stochastics, we can observe that the slope of Stochastics K bearishly turned negative after the market traded as high as 0.051. Stochastics K then bearishly moved below Stochastics D, indicating price depreciation. Stochastics K has just moved above Stochastics D, indicating a possible end to price depreciation.
Stay on top of the cryptocurrency market with CryptoDaily’s trading charts!
https://charts.cryptodaily.net/
Investment Disclaimer