Published
4 years ago on
January 20, 2020
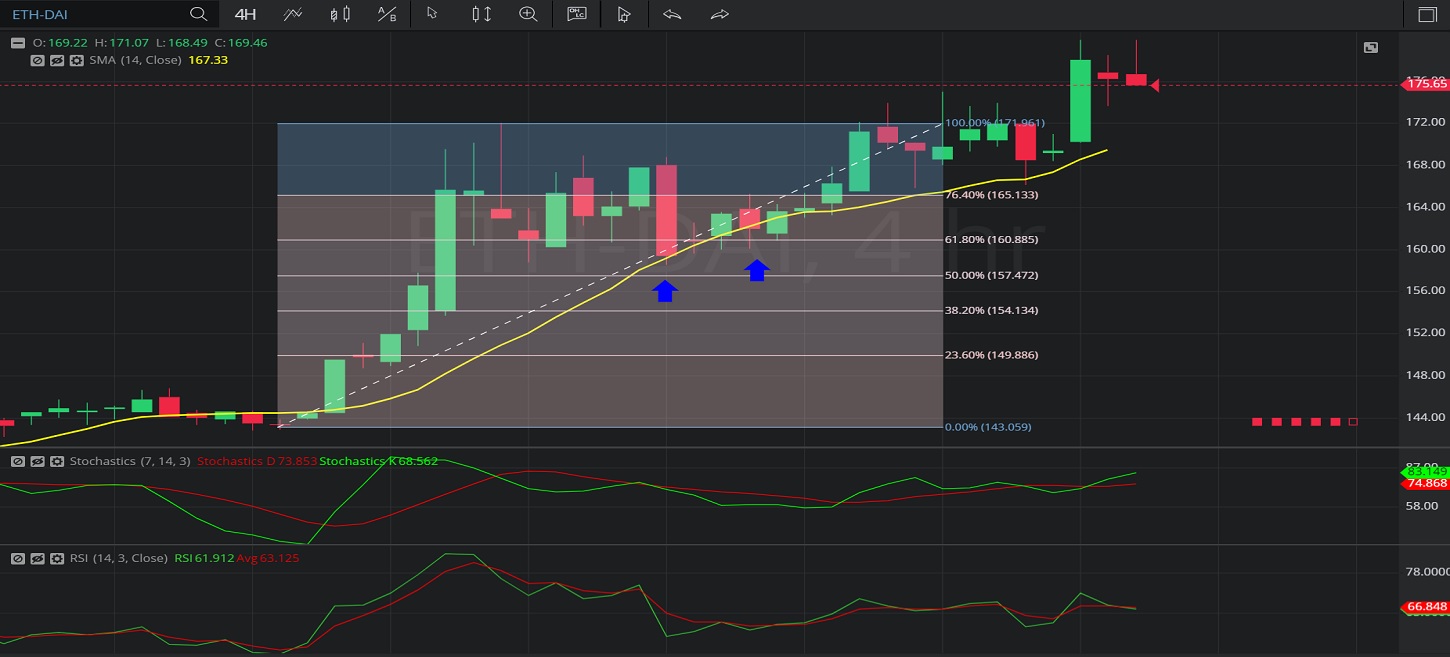
In this 4-hourly chart of Ethereum / Multi-collateral DAI (ETH/ DAI), there is an appreciating range from 142.84 to 172.09.
We can observe that the market then depreciated to the 158.58 level (identified by the blue up arrow), just above the 157.47 level that represents the 50% retracement of the appreciating range.
These levels were also close to the 14-bar Simple Moving Average (identified in yellow), indicating around the 159.15 level.
We can observe that the market then traded around the 160.92 level for several bars, around the 38.2% retracement of the appreciating range.
We can observe that the market then appreciated to the 180.00 level.
Using RSI, we can observe that the slope of RSI (14) and the slope of RSI Average (3) turned positive after the market traded as low as the 157.47 level, and that RSI (14) bullishly moved above RSI Average (3). RSI (14) has since moved below RSI Average (3), suggesting the price appreciation may be ending.
Using Slow Stochastics, we can observe that the slope of Stochastics K and the slope of Stochastics D turned positive after the market traded as low as the 157.47 level. We can also observe that Stochastics K bullishly crossed above Stochastics D, and this coincided with price appreciation. Stochastics K remains above Stochastics D.
Stay on top of the cryptocurrency market with CryptoDaily’s trading charts!
https://charts.cryptodaily.net/
Investment Disclaimer