Published
4 years ago on
January 17, 2020
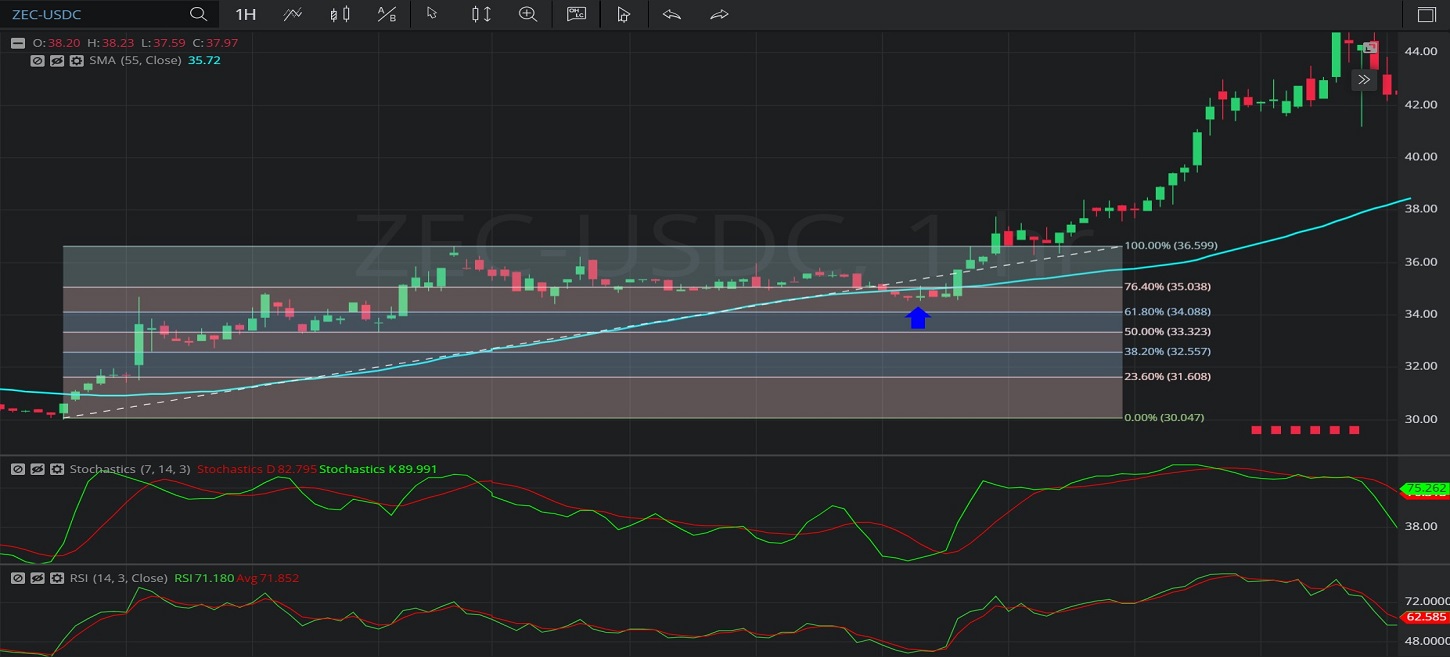
In this Hourly chart of Zcash / United States dollar Coin (ZEC/ USDC), there is an appreciating range from 30.02 to 36.62.
We can observe that the market then depreciated to the 34.54 level (identified by the blue up arrow), not too far below the 35.06 level that represents the 23.6% retracement of the appreciating range.
Notably, the 55-bar Simple Moving Average was indicating around the 34.95 level when the market depreciated to the 34.54 level.
The market then appreciated to the 58.20 level.
Using RSI, we can observe that the slope of RSI (14) and the slope of RSI Average (3) turned positive after the market tested the 23.6% retracement of the appreciating range, and that RSI (14) bullishly moved above RSI Average (3). RSI (14) and RSI Average (3) then moved above and below each other numerous times, and RSI (14) moved back above RSI Average (3) as the market was appreciating to the 58.20 level.
Using Slow Stochastics, we can observe that the slope of Stochastics K turned positive around the time the market traded around the 23.6% retracement of the appreciating range. Stochastics K then crossed above Stochastics D and the slope of Stochastics D then turned positive. Even though Stochastics D then moved above Stochastics K, we can observe that Stochastics K then moved back above Stochastics D when the market appreciated.
Stay on top of the cryptocurrency market with CryptoDaily’s trading charts!
https://charts.cryptodaily.net/
Investment Disclaimer