Published
4 years ago on
January 13, 2020
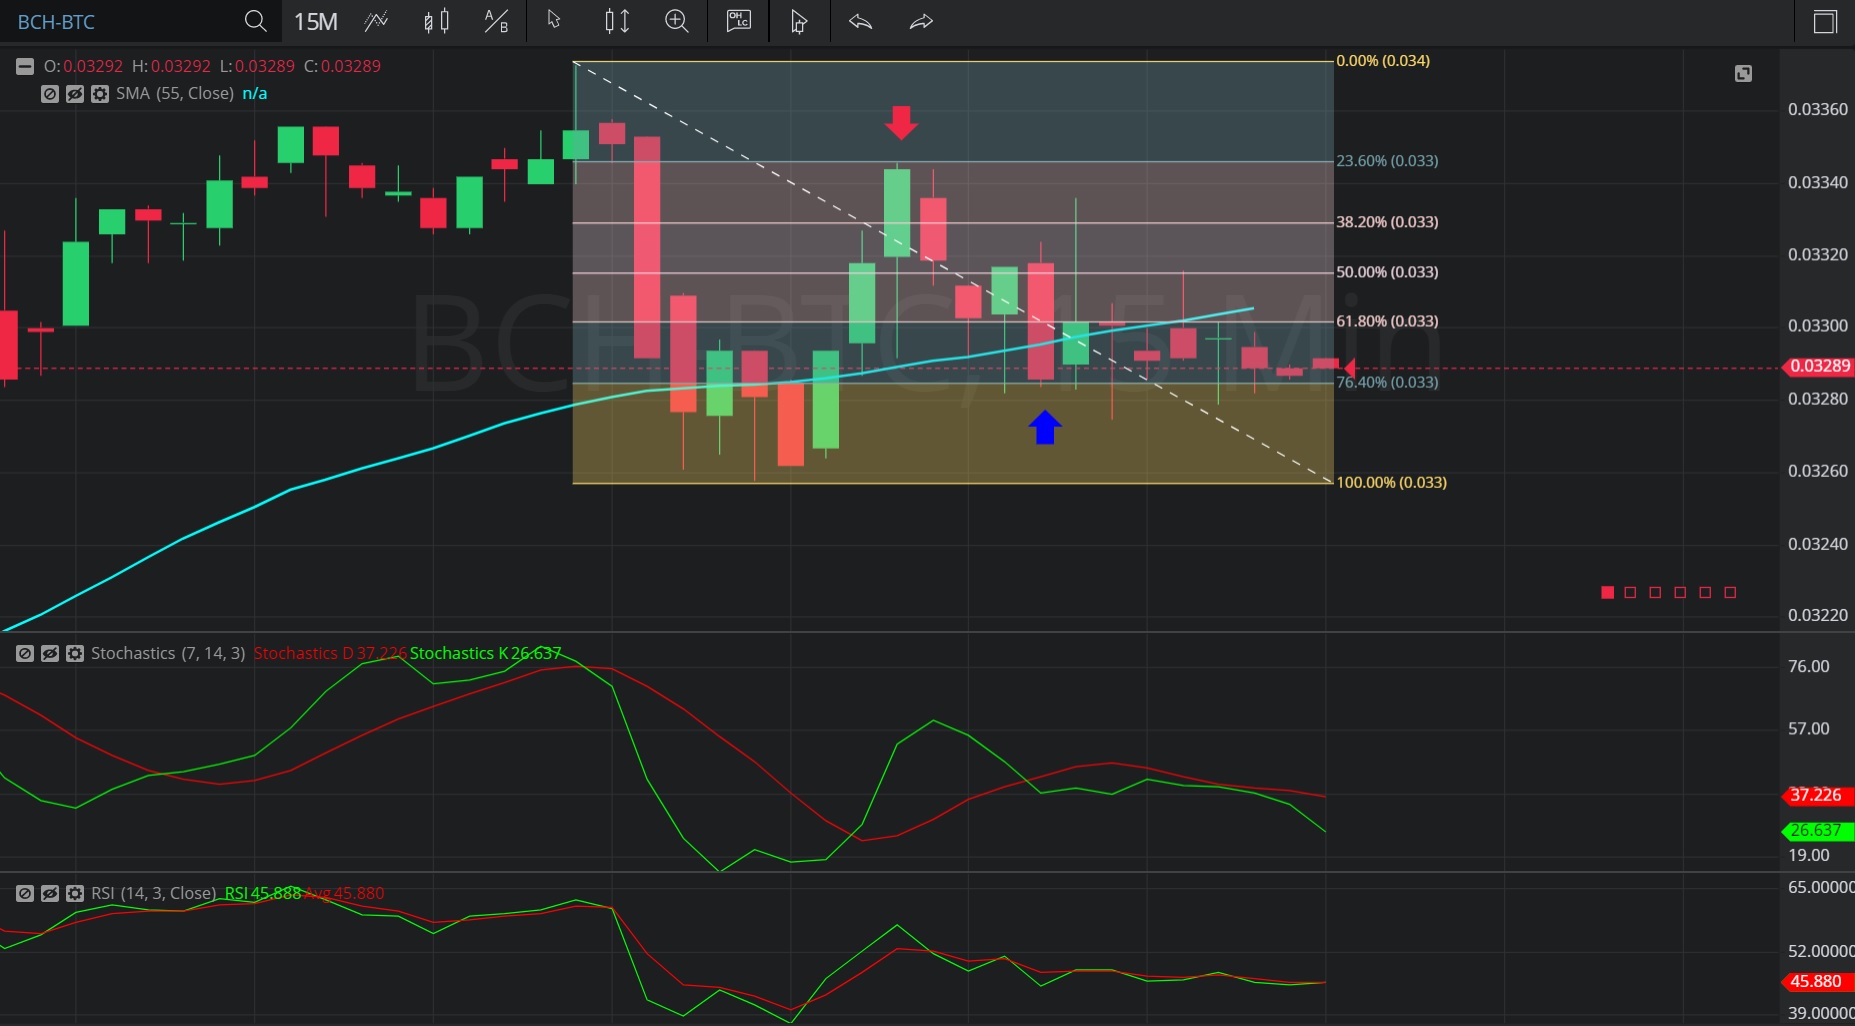
In this 15-minute chart of Bitcoin Cash/ Bitcoin (BCH/ BTC), there is a depreciating range from 0.03373 to 0.03258.
We can observe that the market then appreciated to the 0.03346 level (identified by the red down arrow), right around the 0.0334586 level that represents the 76.4% retracement of the depreciating range.
The market then depreciated as low as the 0.03275 level, and found technical support around the 0.0328514 area that represents the 23.6% retracement of the depreciating range (identified by the blue up arrow).
We can observe that the 55-bar Simple Moving Average was indicating just above the 0.038514 level.
Using RSI, we can observe that the slope of RSI (14) and RSI Average (3) turned negative after the market traded as high as the 0.03346 level. We can also see that RSI Average (3) continues to indicate above RSI (14), suggesting price depreciation may continue.
Using Slow Stochastics, we can observe that the slope of Stochastics K bearishly turned negative after the market traded as high as the 0.03346 level. We can also observe that Stochastics D then bearishly crossed above Stochastics K and that the slopes of both Stochastics D and Stochastics K remain negative, suggesting continued price depreciation is likely.
Stay on top of the cryptocurrency market with CryptoDaily’s trading charts!
https://charts.cryptodaily.net/
Investment Disclaimer