Published
4 years ago on
December 31, 2019
Bitcoin (BTC/USD) gained ground early in today’s Asian session as the pair was lifted to the 7259.65 area after trading as low as the 7200.00 level during yesterday’s European session. The pair had traded as high as the 7531.00 area during Sunday’s North American session before coming off. Traders are curious to see at what price the pair will finish the year, having opened 2019 with a print around 3681.81. The year’s high price was 13868.44 in late June and since then, the market has traded as low as the 6430.00 area, a print from earlier this month. Even though the market will conclude the year nearly double its opening price, by some measures BTC/USD remains weak. Notably, the pair continues to trade well below the psychologically-important 10000 figure.
Another measure of the pair’s relative weakness is its position below the 8185.47 level, representing the 23.6% retracement of the move from 13868.44 to 6430.00. If the pair is able to reclaim this area, the next upside price objective related to this range is the 9271.48 area. Another relative measure of the pair’s performance is its trading activity below the 8498.66 level, representing the 50% retracement of the December-2018 low of 3128.89 to 13868.44. Other important levels in this range include the 5663.42 and 8498.66 areas.
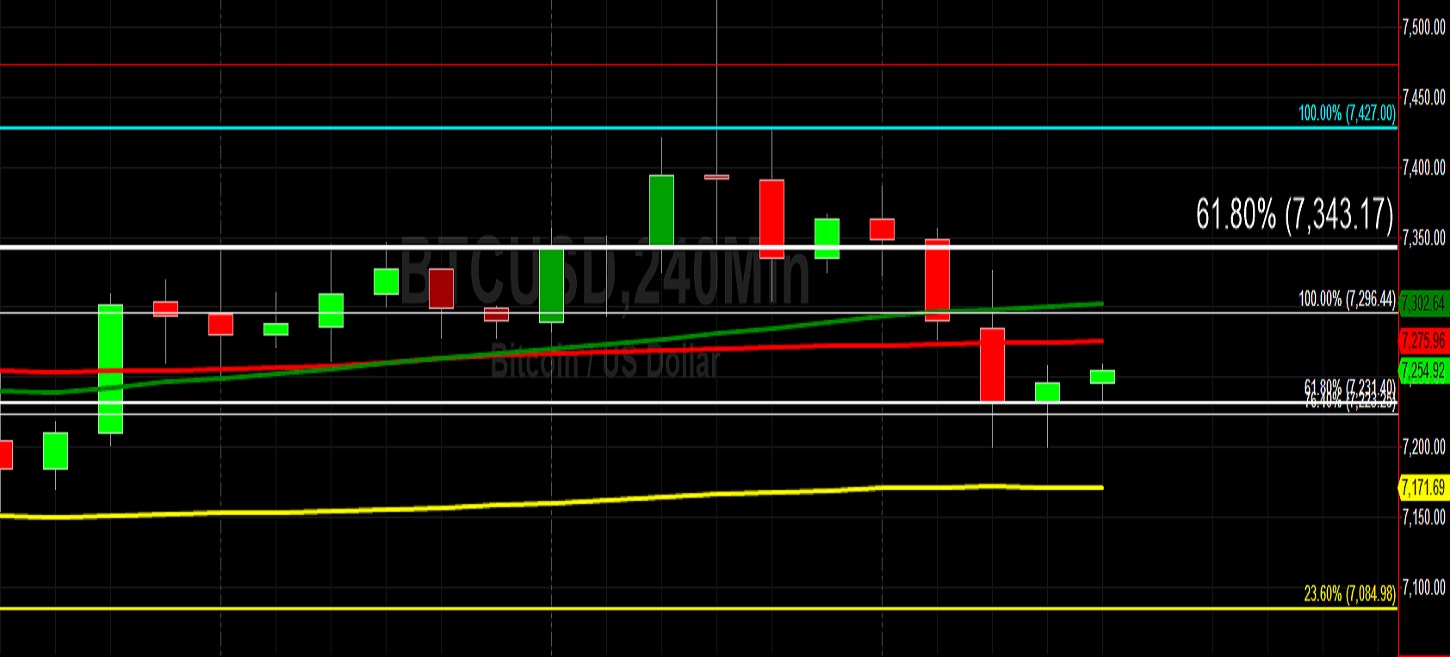
Price activity is nearest the 200-bar MA (4-hourly) at 7,275.95 and the 100-bar MA (Hourly) at 7,280.85.
Technical Support is expected around 6526.00/ 6323.42/ 5941.26 with Stops expected below.
Technical Resistance is expected around 7870.10/ 7927.23/ 8338.78 with Stops expected above.
On 4-Hourly chart, SlowK is Bearishly below SlowD while MACD is Bearishly below MACDAverage.
On 60-minute chart, SlowK is Bullishly above SlowD while MACD is Bearishly below MACDAverage.
Ethereum (ETH/USD) appreciated early in today’s Asian session as the pair headed higher to the 132.19 area after trading as low as the 129.79 area during yesterday’s North American session, down from the 137.85 level during Sunday’s North American session. The pair opened the year trading around the 132.12 level and is not trading far away from that level now, but ETH/USD has experienced its share of trading volatility in 2019. The pair traded as high as the 364.49 area in June and has since traded at a relative low of 116.25 earlier this month. One measure of the pair’s ongoing relative weakness is its trading activity below the 147.60 area, representing the 76.4% retracement of the move from 80.60 to 364.49.
Another measure of the pair’s massive slump in the second half of 2019 is its trading activity below the 174.83 area, representing the 23.6% retracement of the range from 364.49 to 116.25. The pair is actually trading near some important downside price objectives related to its late-October high of 199.50, with the 135.90 and 127.14 areas being important levels. Shorter-term levels that chartists and technicians are monitoring include the 123.50 and 120.73 areas. The 125.16 level represents another important downside price objective.
Price activity is nearest the 100-bar MA (4-hourly) at 130.66 and the 50-bar MA (Hourly) at 131.49.
Technical Support is expected around 119.50/ 115.60/ 111.17 with Stops expected below.
Technical Resistance is expected around 137.85/ 141.74/ 146.00 with Stops expected above.
On 4-Hourly chart, SlowK is Bearishly below SlowD while MACD is Bullishly above MACDAverage.
On 60-minute chart, SlowK is Bullishly above SlowD while MACD is Bearishly below MACDAverage.
Investment Disclaimer