Published
3 years ago on
August 01, 2020
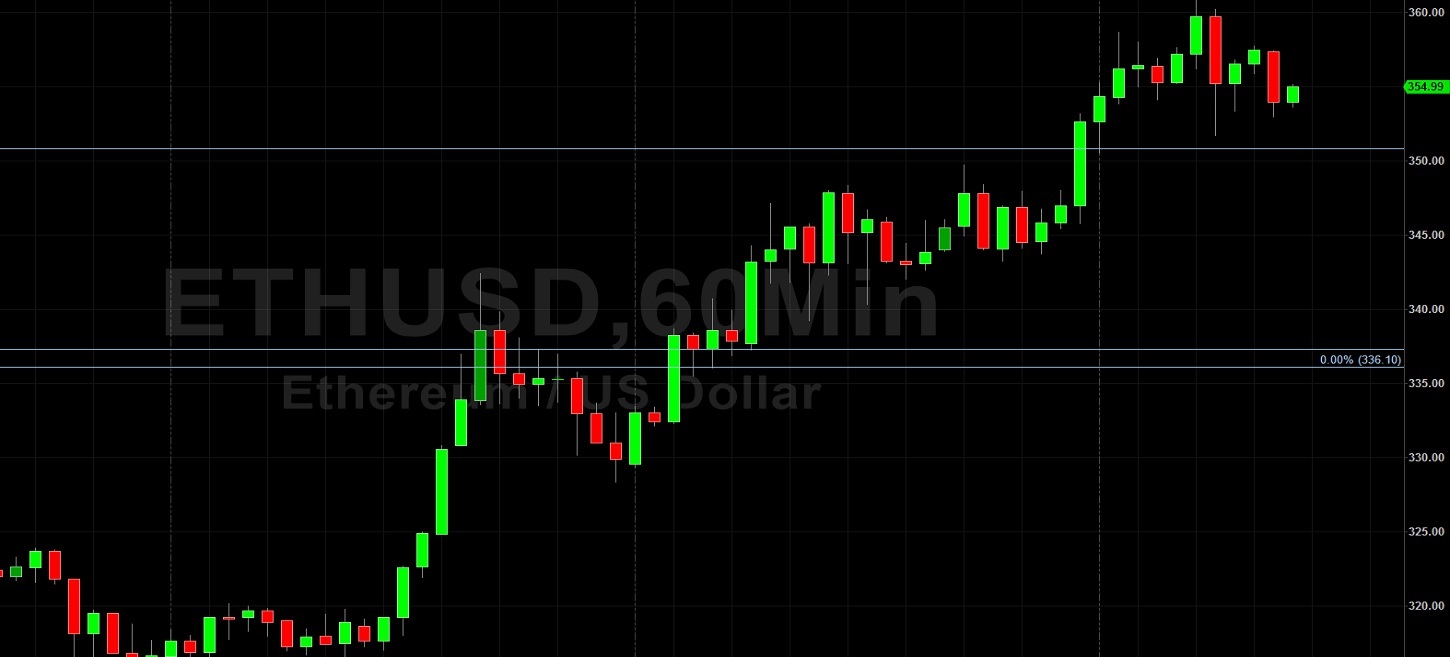
Ethereum (ETH/USD) continued its recent ascent early in today’s North American session as the pair appreciated to the 360.82 area after trading as low as the 343.23 area during the Asian session. Stops were elected above the 350.44 and 354.22 areas during the ascent higher, and upside price objectives remain the 366.48 and 369.26 levels. During last week’s appreciation, Stops were triggered above the 336.10, 337.33, and 342.29 levels, and traders will pay close attention to see how ETH/USD reacts around these levels during retracements lower. Last week, bids emerged just above the 314.07 area, a level that represents the 50% retracement of the broad historical depreciation from the 547.54 to 80.60. Profit-taking earlier this week saw the pair decline to the 312.66 area, a test of the 312.46 area that represents the 23.6% retracement of the appreciating range from 241.62 to 334.34. Last week, profit-taking pushed the pair lower to the 306.29 level, a test of the 305.98 area that represents the 38.2% retracement of the recent appreciating range from 260.10 to 334.34. Stops were recently triggered below the 312.46, 310.62, and 309.66 areas, retracement levels related to recent appreciating ranges from the 241.62, 223.85, and 229.77 areas. Related areas of technical significance that traders will continue to observe include the 312.82, 316.32, and 322.16 areas.
A couple of interesting levels that traders will observe on retracements lower include the 301.20 and 301.40 areas, and they are related to buying pressure that emerged around the 241.62 and 319.86 areas. After crossing the psychologically-important 300.00 figure, technical support is now evident around the 309.66, 294.49, 282.06, and 269.72 levels. If the market fails to sustain its recent move above the 300 area, traders are waiting to see what will happen around areas of technical significance including the 281.81, 275.07, 267.19, 260.83, 254.46, and 246.58 levels. Stronger bids are likely in place around the 298.60, 285.45, 274.82, and 264.18 areas. Appreciating ranges that are technically significant include the move from 229.77 to 334.34, the move from 233.85 to 334.34, the move from 241.62 to 334.34, the move from 260.10 to 334.34, and the appreciation from 90.00 to 334.34. Important technical levels related to those ranges include the 276.68, 269.72, 254.45, and 241.00 areas, and traders are very interested to observe how price activity reacts around these levels. Chartists are observing that the 50-bar MA (4-hourly) is bullishly indicating above the 100-bar MA (4-hourly) and above the 200-bar MA (4-hourly). Also, the 50-bar MA (hourly) is bullishly indicating above the 100-bar MA (hourly) and above the 200-bar MA (hourly).
Price activity is nearest the 50-bar MA (4-hourly) at 317.72 and the 50-bar MA (Hourly) at 341.90.
Technical Support is expected around 305.98/ 293.26/ 281.92 with Stops expected below.
Technical Resistance is expected around 366.48/ 369.26/ 391.82 with Stops expected above.
On 4-Hourly chart, SlowK is Bearishly below SlowD while MACD is Bullishly above MACDAverage.
On 60-minute chart, SlowK is Bearishly below SlowD while MACD is Bearishly below MACDAverage.
Investment Disclaimer