Published
4 years ago on
November 19, 2019
Litecoin
Litecoin (LTC/USD) fell sharply early in today’s Asian session as the pair reached a low around the 53.89 area steady selling from the 60.04 area during Friday’s North American session. Many traders noticed that the pair briefly tested and traded as low as the 56.09 area during last Friday’s North American session, an important technical development given the technical significance of the 56.71 area as the 50% retracement of the recent 47.22 – 66.19 range. The pair’s brief movements below that level opened up potential downside targets such as the 54.47 and 51.70 areas, representing the 61.8% and 76.4% retracements of the same range. Bearish sentiment has returned with LTC/USD now trading below its 200-bar MA (4-hourly).
Regarding LTC/USD’s recent range expansion, the 47.13 area represents possible technical Support and the 23.6% retracement of the 127.95 – 22.17 range. The pair’s next upside price objective related to this range is the 62.58 area, an area the pair tested on 11 November. Another very important technical range that LTC/USD traders are watching is the move from the 182.35 – 22.17 area. The 59.97 area represents the 23.6% retracement of this range, and the 83.36 area is the 38.2% retracement of this range. Additionally, the 192.89 – 22.17 range is another important one, and the 62.46 area represents the 23.6% retracement of this range.
Price activity is nearest the 200-bar MA (4-hourly) at 57.83 and the 100-bar MA (Hourly) at 58.33.
Technical Support is expected around 52.15/ 50.25/ 47.13 with Stops expected below.
Technical Resistance is expected around 64.40/ 69.47/ 75.06 with Stops expected above.
On 4-Hourly chart, SlowK is Bullishly above SlowD while MACD is Bearishly below MACDAverage.
On 60-minute chart, SlowK is Bullishly above SlowD while MACD is Bearishly below MACDAverage.
Bitcoin Cash
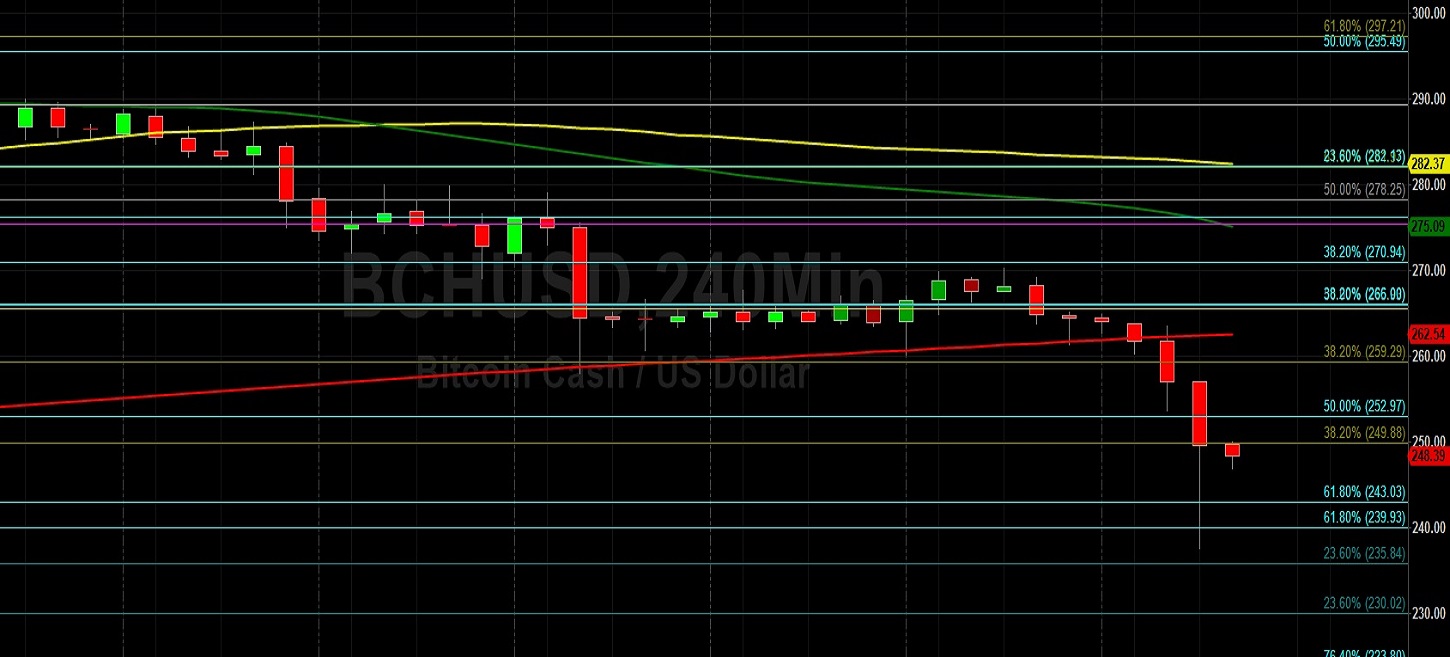
Bitcoin Cash (BCH/USD) fell sharply early in today’s Asian session as the pair weakened to the 237.50 area after peaking around the 270.27 area late in Sunday’s North American session. Some traders had retained a neutral market outlook and bias regarding BCH/USD while it remained above the 252.97 area, representing the 50% retracement of the 197.92 – 308.21 range that commenced from 23 October. The technical relevance of this range had been confirmed by the pair’s recent price activity around the 266.00 level, representing the 38.2% retracement of the same range. With major Stops elected below this level during yesterday’s North American session, the outlook has dimmed considerably.
On the downside, traders will pay close attention to the range’s downside price targets including the 239.98 and 223.80 areas, representing the range’s 61.8% and 76.4% retracements. Before challenging those downside targets, however, the 243.03 area represents the 61.8% retracement of the 73.22 – 517.75 range and Stops were triggered below. Chartists are also eyeing the 200-bar MA (4-hourly) as an area that recently provided technical Support when indicating around the 258.75 area. Traders are now eyeing the 235.84 and 230.02 areas as important downside technical Support levels.
Price activity is nearest the 200-bar MA (4-hourly) at 262.54 and the 50-bar MA (Hourly) at 262.95.
Technical Support is expected around 235.84/ 259.29/ 252.97 with Stops expected below.
Technical Resistance is expected around 252.97/ 230.02/ 223.80 with Stops expected above.
On 4-Hourly chart, SlowK is Bullishly above SlowD while MACD is Bearishly below MACDAverage.
On 60-minute chart, SlowK is Bullishly above SlowD while MACD is Bearishly below MACDAverage.
Investment Disclaimer