Published
4 years ago on
November 15, 2019
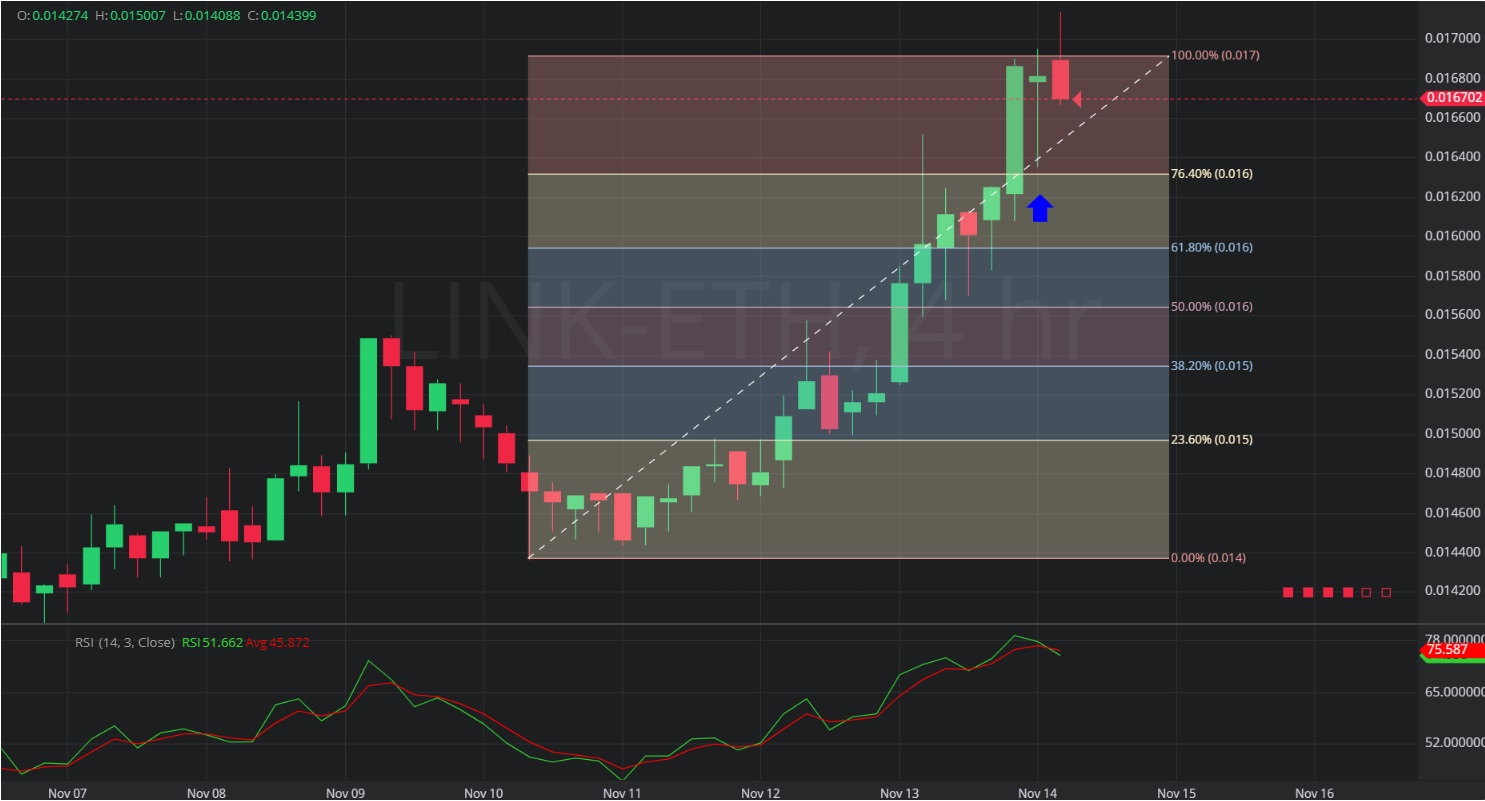
In this 4-hourly chart of Chainlink/ Ethereum (LINK/ETH), there is an appreciation from 0.014366 to 0.016904.
We can see the price then depreciated to the 0.016355 level (indicated by the blue up arrow), just above the 0.16305 level that represents the 23.6% retracement of the appreciating range.
We can RSI (14) plotted and we can see RSI Average (3) crossing above RSI (14) on the last bar shown, a bearish development that coincided with a market pullback.
We can see an indication of market weakness prior to the crossover when the slope of RSI (14) became negative, and this bearishly preceded the slope of RSI Average (3) becoming negative.
Stay on top of the cryptocurrency market with CryptoDaily’s trading charts!
https://charts.cryptodaily.net/
Investment Disclaimer