Published
4 years ago on
November 05, 2019
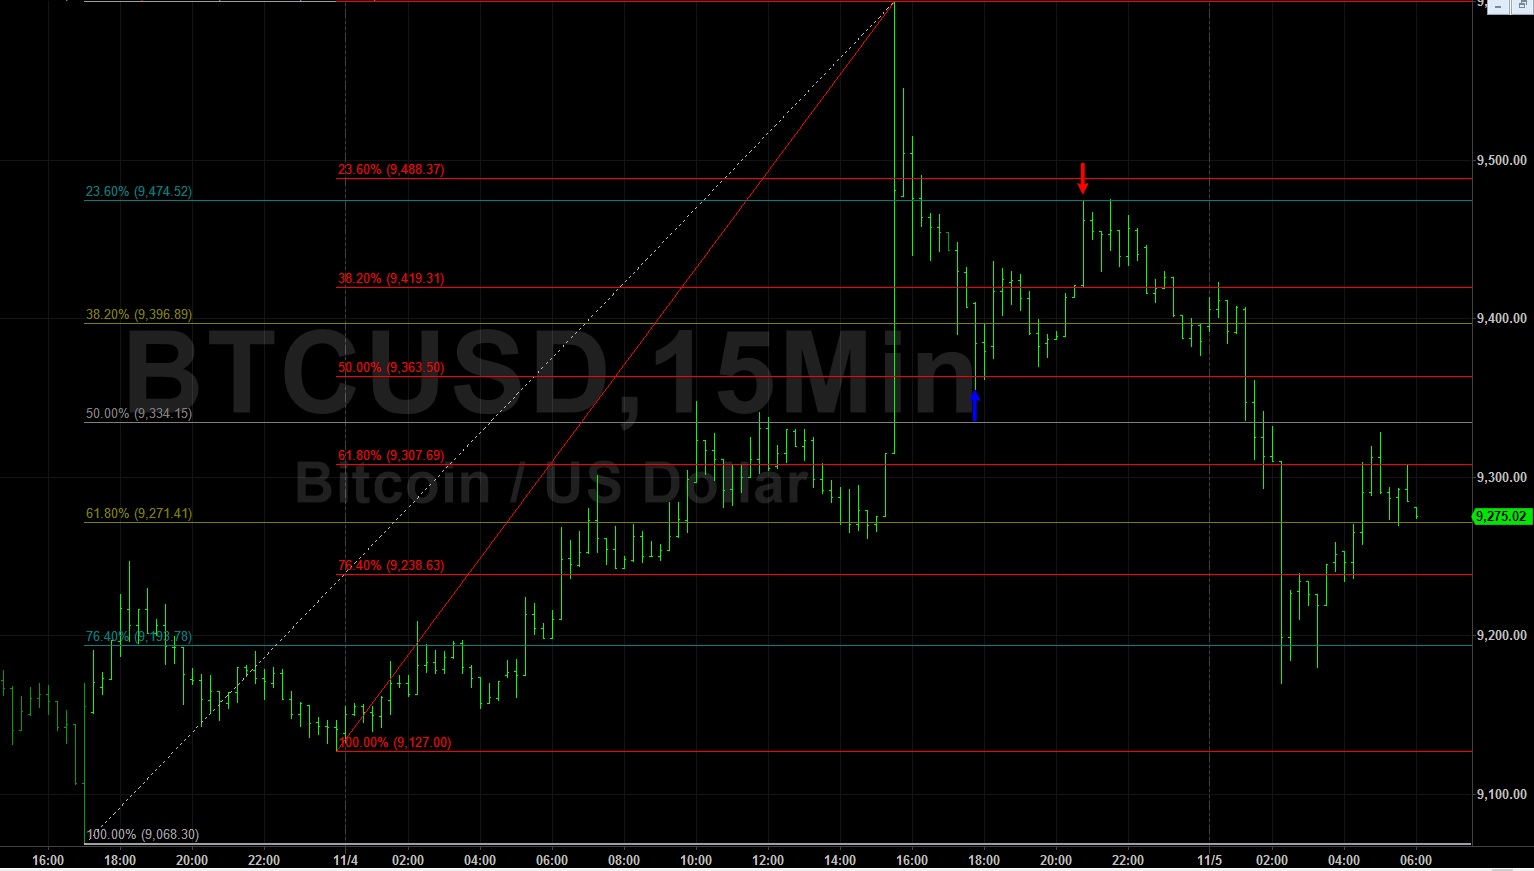
BTC/USD
Bitcoin/ United States dollar
15 minutes
In this 15-minute chart, we can see that price activity depreciated and tested the 9363.50 area (blue arrow), a level that represents the 50% retracement of the intraday appreciation from 9127.00 to 9600.00.
Price activity then appreciated to the 9439.31 area (red arrow), a level that represents the 38.2% retracement of the same range, and then appreciated further to test the 9474.52 area (red arrow), a level that represents the 23.6% retracement of the appreciation from 9068.30 to 9600.00.
Stay ahead of the market with CryptoDaily's charts.
Visit https://charts.cryptodaily.net to get started today.