Published
4 years ago on
July 21, 2019
Bitcoin
Bitcoin (BTC/USD) gained ground early in today’s Asian session as traders lifted the pair to the 11,042.00 area following steady demand that resumed during yesterday’s Asian session. Stops were elected above the 10,958.60 area during the pair’s ascent late during yesterday’s North American session, a level that represents the 50% retracement of the 8,048.75 – 13,868.44 range. The next upside levels related to this range include the 11,645.32 and 12,494.99 areas.
The pair tested the 50-bar MA (4-hourly) during yesterday’s European session and then moved above the area during the push to multi-session highs. BTC/USD is now trading just below the 100-bar MA (4-hourly), now indicating around the 11,134.70 area. BTC/USD bulls face some immediate upside price pressures above its current level. Chartists anticipate some significant technical Resistance between the 11,262 – 11,439 levels. A couple of other important levels that technicians are watching include the 11,510 and 11,759 areas, with the latter representing the 50% retracement of the 13,868.44 – 9,651.00 range.
Price activity is nearest the 100-bar MA (4-hourly) at 11,134.70 and the 50-bar MA (Hourly) at 10,571.06.
Technical Support is expected around 10,268.07/ 10,046.06/ 9,532.39 with Stops expected below.
Technical Resistance is expected around 11,202.00/ 11,510.44/ 12,227.57 with Stops expected above.
On 4-Hourly chart, SlowK is Bullishly above SlowD while MACD is Bullishly above MACDAverage.
On 60-minute chart, SlowK is Bullishly above SlowD while MACD is Bullishly above MACDAverage.
Ethereum
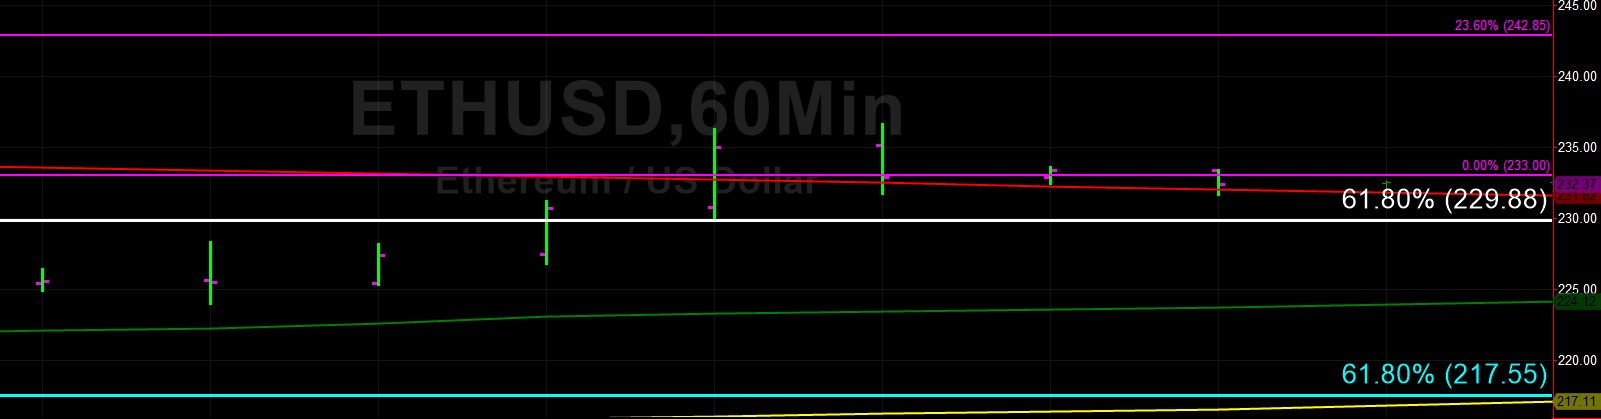
Ethereum (ETH/USD) appreciated early in today’s Asian session as the pair traded as high as the 236.58 area, resuming its steady climb higher that began during Thursday’s North American session. The 222.55 area again provided some important technical Support during yesterday’s North American session, a level that represents the 50% retracement of the 80.60 – 364.49 range. The next upside level related to this range is the 256.04 area.
ETH/USD finally tested the 50-bar MA (4-hourly) late during yesterday’s North American session, and technical Resistance emerged right around the 236.43 area, representing the 61.8% retracement of the move from 157.28 to 364.49. The next upside retracement areas related to this range include the 260.89 and 285.34 areas. Technicians are eyeing some Offers between the 246 – 249 areas and additional technical Resistance is expected between the 255 – 259 levels.
Price activity is nearest the 50-bar MA (4-hourly) at 231.20 and the 200-bar MA (Hourly) at 231.62.
Technical Support is expected around 217.55/ 206.18/ 191.40 with Stops expected below.
Technical Resistance is expected around 242.85/ 257.22/ 265.15 with Stops expected above.
On 4-Hourly chart, SlowK is Bullishly above SlowD while MACD is Bullishly above MACDAverage.
On 60-minute chart, SlowK is Bearishly below SlowD while MACD is Bullishly above MACDAverage.
Investment Disclaimer