Published
4 years ago on
June 04, 2019
Bitcoin
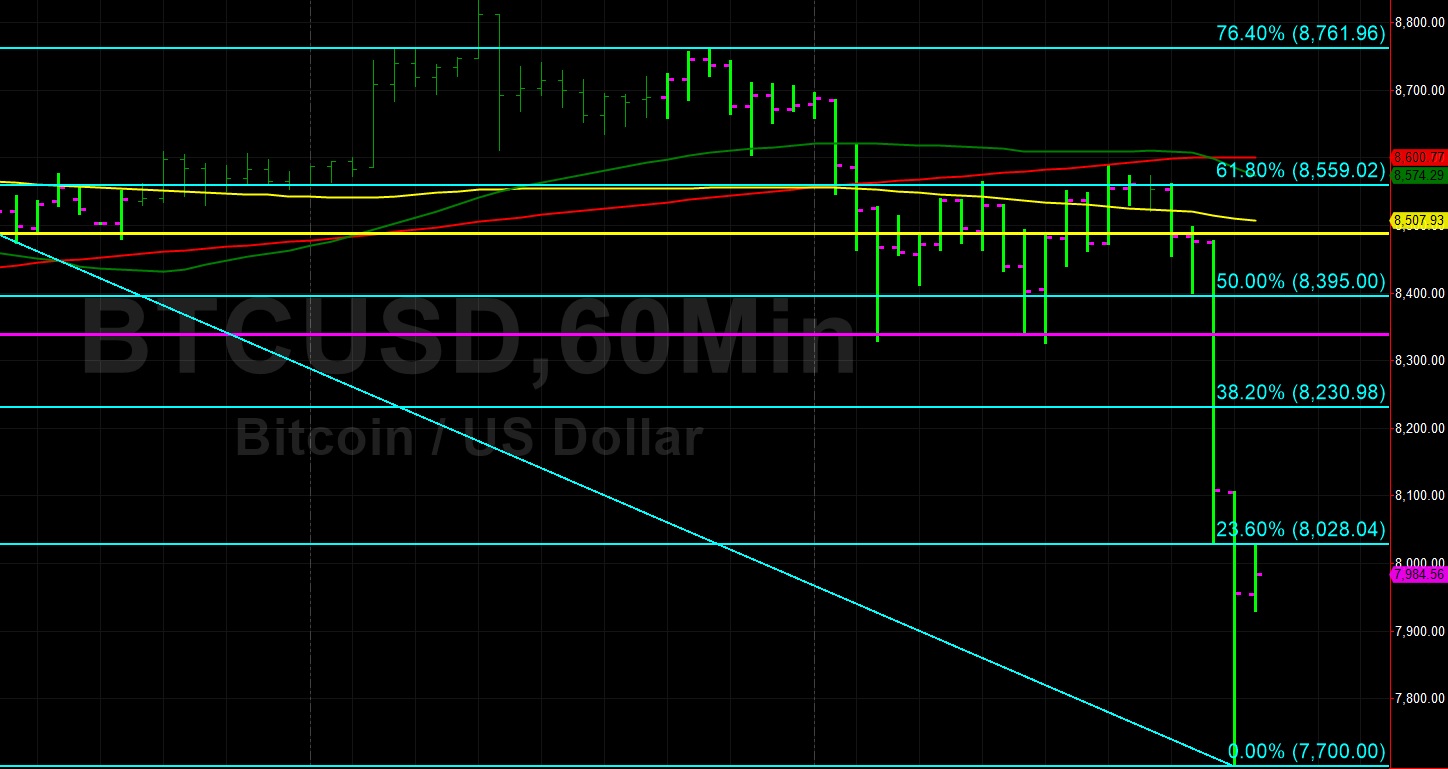
Bitcoin (BTC/USD) depreciated sharply early in today’s Asian session, declining to the 7700.00 area after being unable to climb above the 8588.66 area during yesterday’s North American session. Yesterday’s selloff commenced during the Asian session and BTC/USD quickly weakened from the 8695.21 area during yesterday’s European session. Traders tested the 8338.78 area, representing the 76.4% retracement of the move from 9948.12 to 3128.89, and that level eventually gave way, resulting in Stops being elected below the 100-bar MA (4-hourly).
Stops were then triggered below the 8087.05 area late in yesterday’s North American session, representing the 61.8% retracement of the move from 7467.10 to 9090.00. Stops were also then elected below the 7724.78 area, representing the 38.2% retracement of the move from 5516.12 to 9090.00. Chartists are focused on additional downside market risk with the 7551.18 area as another important level, representing the 61.8% retracement of the move from 5072.01 to 9090.00. Additionally, the 7343.17 level represents the 61.8% retracement of the 9948.12 – 3128.89 range.
Price activity is nearest the 200-bar MA (4-hourly) at 7410.27 and the 100-bar MA (Hourly) at 8507.77.
Technical Support is expected around 7551.18/ 7223.25/ 6881.34 with Stops expected below.
Technical Resistance is expected around 8230.98/ 8566.38/ 8761.96 with Stops expected above.
On 4-Hourly chart, SlowK is Bearishly below SlowD while MACD is Bearishly below MACDAverage.
On 60-minute chart, SlowK is Bearishly below SlowD while MACD is Bearishly below MACDAverage.
Ethereum
Ethereum (ETH/USD) extended its recent selloff early in today’s Asian session, trading as low as the 237.00 area after steady selling pressure emerged during yesterday’s European and North American sessions. The pair orbited the 100-bar MA (4-hourly) during yesterday’s sessions but the level finally gave way, quickly plunging to test the 246.88 area, representing the 38.2% retracement of the move from 515.88 to 80.60. Various Stops were then elected below the 238 – 239 areas where some technical Support had been in place.
Some shorts were covered just above the 236.89 area, representing the 23.6% retracement of the move from 281.99 to 222.99. Traders are focused on additional downside risk for ETH/USD with some key levels now at the fore. There are various technical Support levels between the 231 – 236 areas and the 200-bar MA (4-hourly) is currently around the 224.09 level. Notably, the 234.23 area represents the 38.2% retracement of the move from 146.00 to 288.77.
Price activity is nearest the 100-bar MA (4-hourly) at 258.63 and the 100-bar MA (Hourly) at 263.39.
Technical Support is expected around 234.23/ 217.39/ 200.54 with Stops expected below.
Technical Resistance is expected around 262.11/ 276.18/ 281.64 with Stops expected above.
On 4-Hourly chart, SlowK is Bearishly below SlowD while MACD is Bearishly below MACDAverage.
On 60-minute chart, SlowK is Bullishly above SlowD while MACD is Bearishly below MACDAverage.
Investment Disclaimer