
Published
4 years ago on
June 02, 2019
Bitcoin
Bitcoin (BTC/USD) continued its move higher early in today’s Asian session as the pair traded as high as the 8609.29 area with its sights set on the 8662.92 area, representing the 61.8% retracement of the move from 9090.00 to 7972.00. During yesterday’s North American session, the pair tested the 8470.05 area, representing the 38.2% retracement of the move from 7467.10 to 9090.00. That level was also just above the 50-bar MA (4-hourly), levels that BTC/USD has remained above since Friday.
Some technical clues emerged late in yesterday’s North American session when the pair found experienced buying pressure around the 8531.00 figure, representing the 50% retracement of the aforementioned 9090.00 – 7972.00 range. Stops are expected to be situated above the 8662.92 area and if they are elected, BTC/USD could test the 8707.00 area, representing the 23.6% retracement of the move from 7467.10 to 9090.00. Above that area, the 8826.15 area is technical Resistance and represents the 76.4% retracement of the aforementioned 9090.00 – 7972.00 range. Chartists also continue to focus on the 9532.39 area as an important upside target, along with 9213/ 9405/ 10,271.
Price activity is nearest the 50-bar MA (4-hourly) at 8488.97 and the 100-bar MA (Hourly) at 8547.62.
Technical Support is expected around 8399.08/ 8235.08/ 7850.10 with Stops expected below.
Technical Resistance is expected around 9090.00/ 9532.02/ 9948.12 with Stops expected above.
On 4-Hourly chart, SlowK is Bullishly above SlowD while MACD is Bullishly above MACDAverage.
On 60-minute chart, SlowK is Bearishly below SlowD while MACD is Bearishly below MACDAverage.
Ethereum
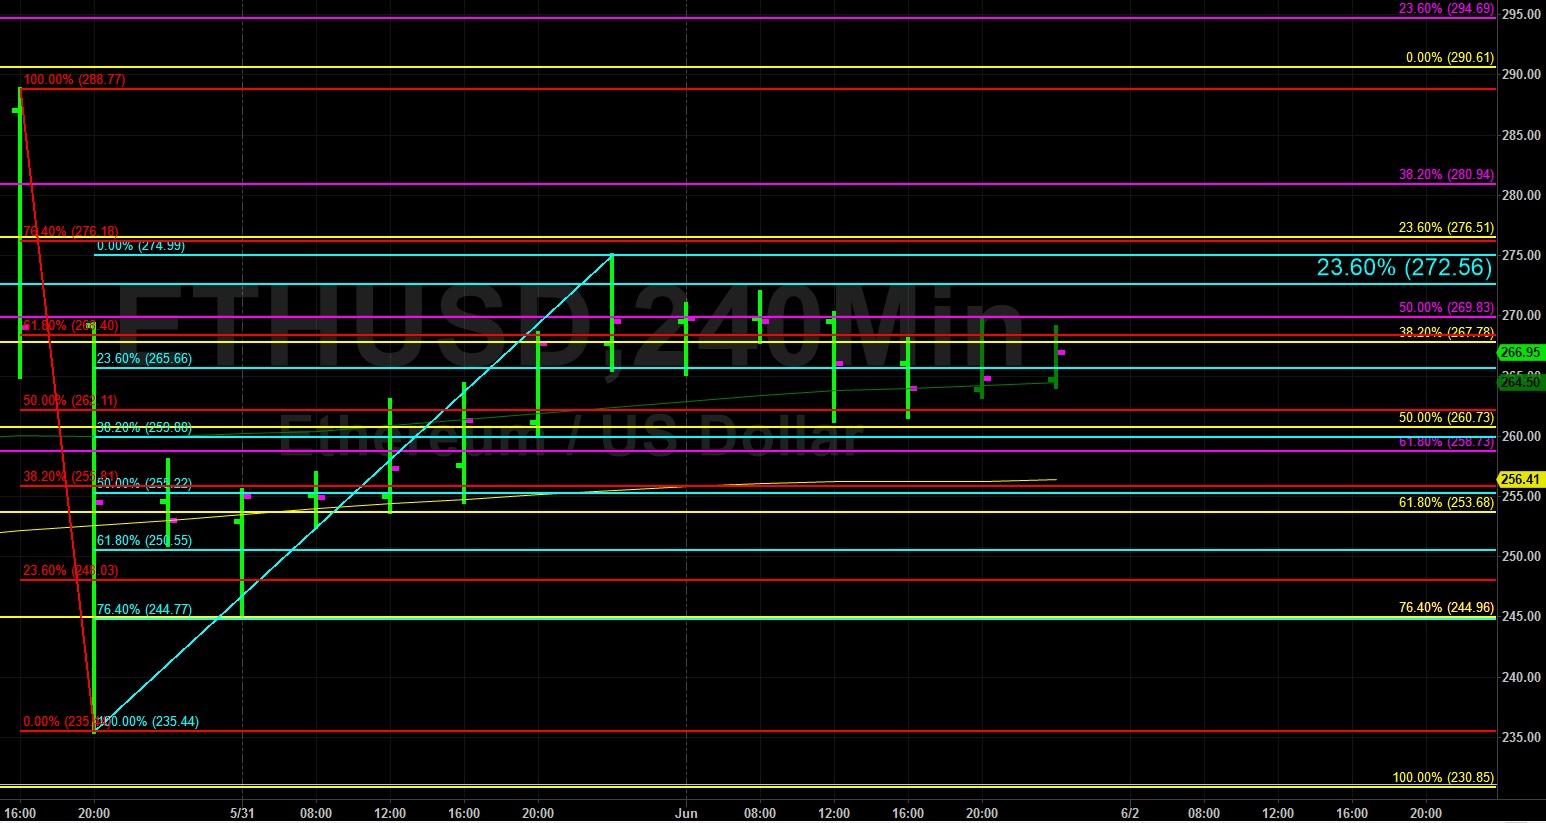
Ethereum (ETH/USD) encountered some light upward price pressure early in today’s Asian session after being pressured lower during yesterday’s European session and being unable to sustain modest gains in the North American session. Yesterday’s test of the technically-important 275.16 area was toppish for the pair and ETH/USD eventually slid as low as the 261.30 area after some Stops were triggered below the 50-bar MA (4-hourly). Following the move lower, the pair tested the 269.76 area during yesterday’s North American session, representing the 61.8% retracement of the move from 274.99 to 261.30.
Below current price activity, chartists are focusing on levels such as 259.95/ 257.22/ 255.83 to see if they represent decent technical Support during a move lower. Additionally, the 100-bar MA (4-hourly) is currently indicating at 256.42. Above current price activity, technicians are focusing on levels including 272.56/ 275.16/ 281.77. Also, the 276.18 area represents the 76.4% retracement of the move from 288.77 to 235.44. Traders are also focusing on 293.56/ 298.24/ 302.20 as upside price targets.
Price activity is nearest the 50-bar MA (4-hourly) at 264.53 and the 100-bar MA (Hourly) at 267.59.
Technical Support is expected around 259.88/ 244.96/ 235.44 with Stops expected below.
Technical Resistance is expected around 281.77/ 289.64/ 298.24 with Stops expected above.
On 4-Hourly chart, SlowK is Bullishly above SlowD while MACD is Bearishly below MACDAverage.
On 60-minute chart, SlowK is Bullishly above SlowD while MACD is Bearishly below MACDAverage.
Investment Disclaimer


