Published
4 years ago on
June 12, 2019
Bitcoin
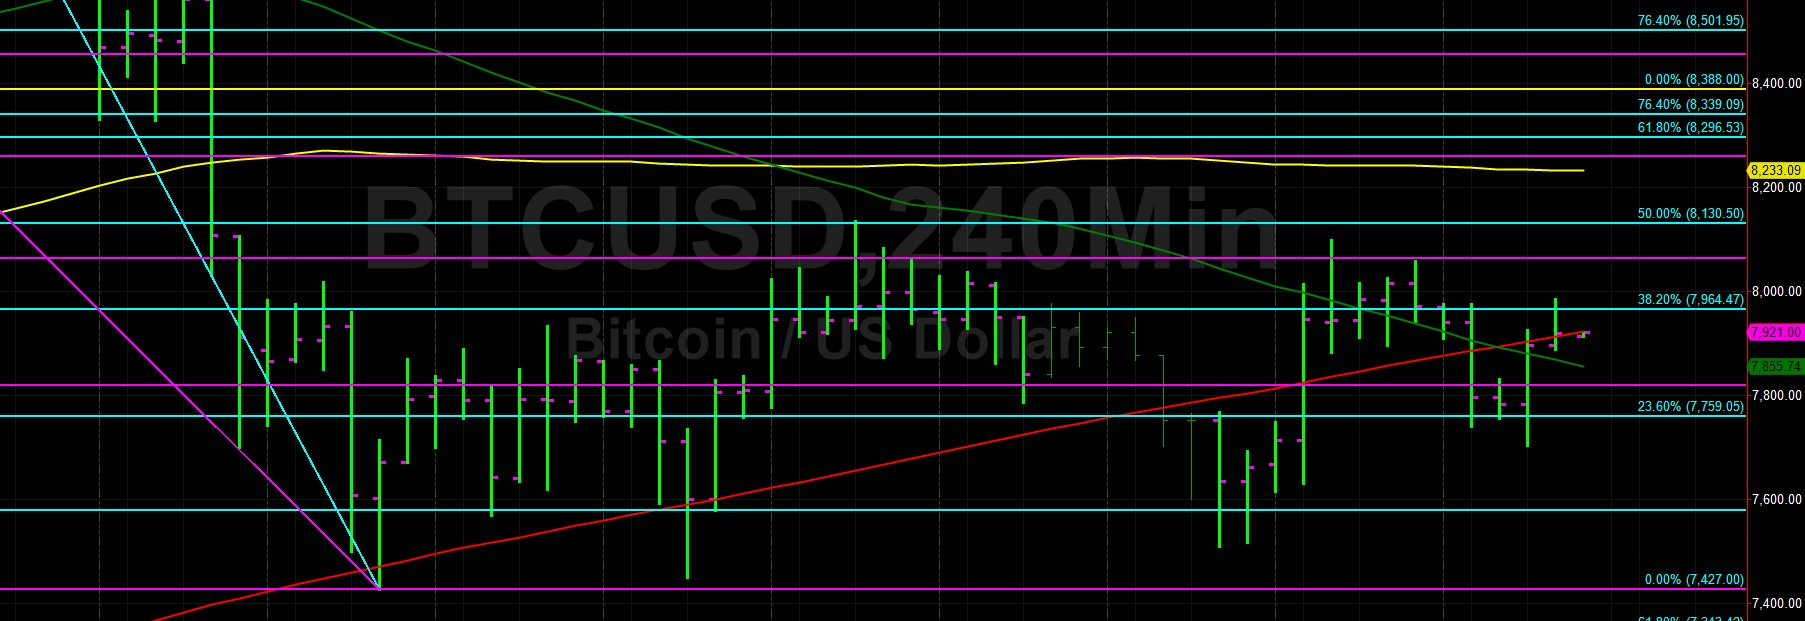
Bitcoin (BTC/USD) appreciated early in today’s Asian session with the pair reaching the 7985.00 area after finding buying demand around the 7702.83 area late in yesterday’s North American session. Technically, the pair depreciated late in yesterday’s European session, falling to the 7740.00 area, representing the 61.8% retracement of the move from 7508.77 – 8097.35. The pair then came off further late in the North American session.
If BTC/USD is going to take a run higher, it will need to firmly move above the 7958.45 area, representing the 23.6% retracement of the same range. The 8004.24 area is a short-term level that BTC/USD must absorb if it will advance higher. Above that area, there is some technical Resistance between the 8062 – 8138 area and then then 200-bar MA (4-hourly) is now indicating around the 8233.40 area.
Price activity is nearest the 50-bar MA (4-hourly) at 7939.22 and the 200-bar MA (Hourly) at 7945.02.
Technical Support is expected around 7343.17/ 7187.64/ 6881.34 with Stops expected below.
Technical Resistance is expected around 8230.98/ 8566.38/ 8761.96 with Stops expected above.
On 4-Hourly chart, SlowK is Bullishly above SlowD while MACD is Bullishly above MACDAverage.
On 60-minute chart, SlowK is Bearishly below SlowD while MACD is Bullishly above MACDAverage.
Ethereum
Ethereum (ETH/USD) was pressured early in today’s Asian session, trading as low as the 245.53 level after trading as high as the 248.04 area during yesterday’s North American session. Stops were elected above the 246.54 area during the move higher, representing the 76.4% retracement of the move from 249.38 – 237.33. The 246.88 area also came back into spotlight early in today’s Asian session.
The 50-bar MA (hourly) is now converging with the 100-bar MA (hourly) and 200-bar MA (hourly) and if it is crosses above, it could be Bullish for ETH/USD. Above the market, the 249.90 and 258.80 areas are important areas to watch. Additionally, the 265.15 and 272.56 areas are closely being monitored by chartists. Stops are likely in place above the 274.75 area.
Price activity is nearest the 200-bar MA (4-hourly) at 242.63 and the 200-bar MA (Hourly) at 244.40.
Technical Support is expected around 223.08 / 217.55/ 209.75 with Stops expected below.
Technical Resistance is expected around 249.90/ 258.80/ 266.75 with Stops expected above.
On 4-Hourly chart, SlowK is Bullishly above SlowD while MACD is Bullishly above MACDAverage.
On 60-minute chart, SlowK is Bullishly above SlowD while MACD is Bullishly above MACDAverage.
Investment Disclaimer