Published
4 years ago on
May 31, 2019
Bitcoin
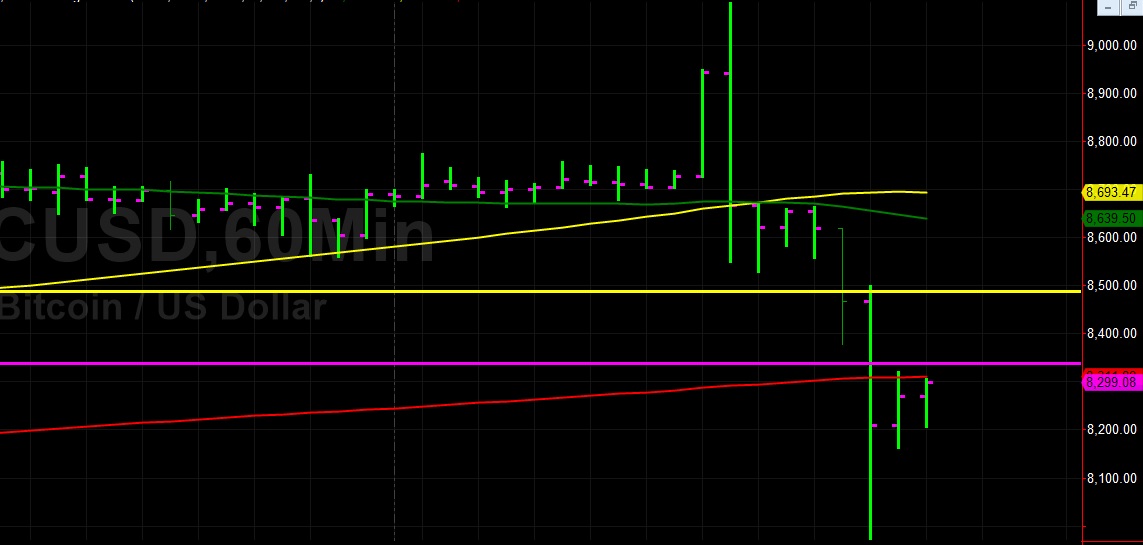
Bitcoin (BTC/USD) depreciated sharply early in today’s Asian session following the pair’s ascent to the 9090.00 level during yesterday’s North American session, its strongest print for several months. Stops were elected above the 8824.74 area during yesterday’s move higher, representing the 76.4% retracement of the move from 8947.88 to 8426.09. BTC/USD depreciated to the 7972.00 level early in the Asian session after Stops were elected below some key retracement areas including 8278.55 and 8087.05.
Stops were also triggered below the 8324.13 level, representing the 50-bar MA (4-hourly), and then below the 8063.08 area, representing the 100-bar MA (4-hourly). Buying demand emerged just above a key retracement level, as 7966.03 is the 76.4% retracement of the move from 8388.00 to 6600.00. Chartists are eyeing some additional technical Support below current price activity, especially around the 7910/ 7850/ 7704 levels.
Price activity is nearest the 100-bar MA (4-hourly) at 8063.20 and the 200-bar MA (Hourly) at 8311.61.
Technical Support is expected around 7850.10/ 7659.87/ 7343.17 with Stops expected below.
Technical Resistance is expected around 9090.00/ 9532.02/ 9948.12 with Stops expected above.
On 4-Hourly chart, SlowK is Bearishly below SlowD while MACD is Bearishly below MACDAverage.
On 60-minute chart, SlowK is Bullishly above SlowD while MACD is Bearishly below MACDAverage.
Ethereum
Ethereum (ETH/USD) depreciated sharply early in today’s Asian session as the pair fell to the 235.44 area, its weakest print since in more than one week. ETH/USD had shown some bullishness prior to the depreciation after Stops were triggered above the 274.98 area, representing the 76.4% retracement of the move from 279.55 to 260.20. Additional Stops were elected above recent relative highs including the 279.55 and 281.77 areas.
The pair established a fresh multi-month high around the 288.77 area late in yesterday’s North American session before the sharp selling pressure commenced. During the move lower, additional Stops were triggered below 50-bar MA (4-hourly) and 100-bar MA (4-hourly). Buying demand eventually emerged around a couple of interesting retracement levels, including the 23.6% retracement of the move from 281.77 to 222.88 and the 38.2% retracement of the move from 157.28 to 281.77.
Price activity is nearest the 100-bar MA (4-hourly) at 252.56 and the 200-bar MA (Hourly) at 259.59.
Technical Support is expected around 231.12/ 219.53/ 209.75 with Stops expected below.
Technical Resistance is expected around 281.77/ 289.64/ 298.24 with Stops expected above.
On 4-Hourly chart, SlowK is Bearishly below SlowD while MACD is Bearishly below MACDAverage.
On 60-minute chart, SlowK is Bullishly above SlowD while MACD is Bearishly below MACDAverage.
Investment Disclaimer