Published
5 years ago on
April 03, 2019

Ethereum (ETH) just keeps surging with no signs of slowing down despite ETH/USD being heavily overbought on the weekly time frame. Ethereum (ETH) is far ahead of Bitcoin (BTC) and is currently testing the market structure that it broke in November, 2018. This level that used to be a strong support has now turned into a strong resistance and the price is unlikely to break past it. We may see some wicks to the upside but the weekly candle is extremely unlikely to close above this level. The price is due for a major decline in the weeks ahead and ETH/USD might end up falling lower than its December, 2018 lows. Stochastic RSI on the weekly time frame has been in overbought territory since beginning of the year but the price keeps on defying gravity and shows no signs of a slowdown.
The weekly chart for ETH/USD shows that Ethereum (ETH) has yet to break a strong trend line resistance which coincides with the resistance at $176.71. This confluence of horizontal resistance and trend line resistance has now made it extremely difficult for the price to trade higher. On the other hand, if ETH/USD slides below the 21 week exponential moving average and closes the week below it, we might see the price drop a lot further in the weeks ahead. It would not be surprising to see ETH/USD drop below its previous lows should that happen. The fact that Bitcoin (BTC) pumped harder than altcoins during the recent pump has made it clear that altcoins are now very likely to see new lows if Bitcoin (BTC) falls further. While Bitcoin (BTC) may not see new lows during its next decline, Ethereum (ETH) is extremely like to.
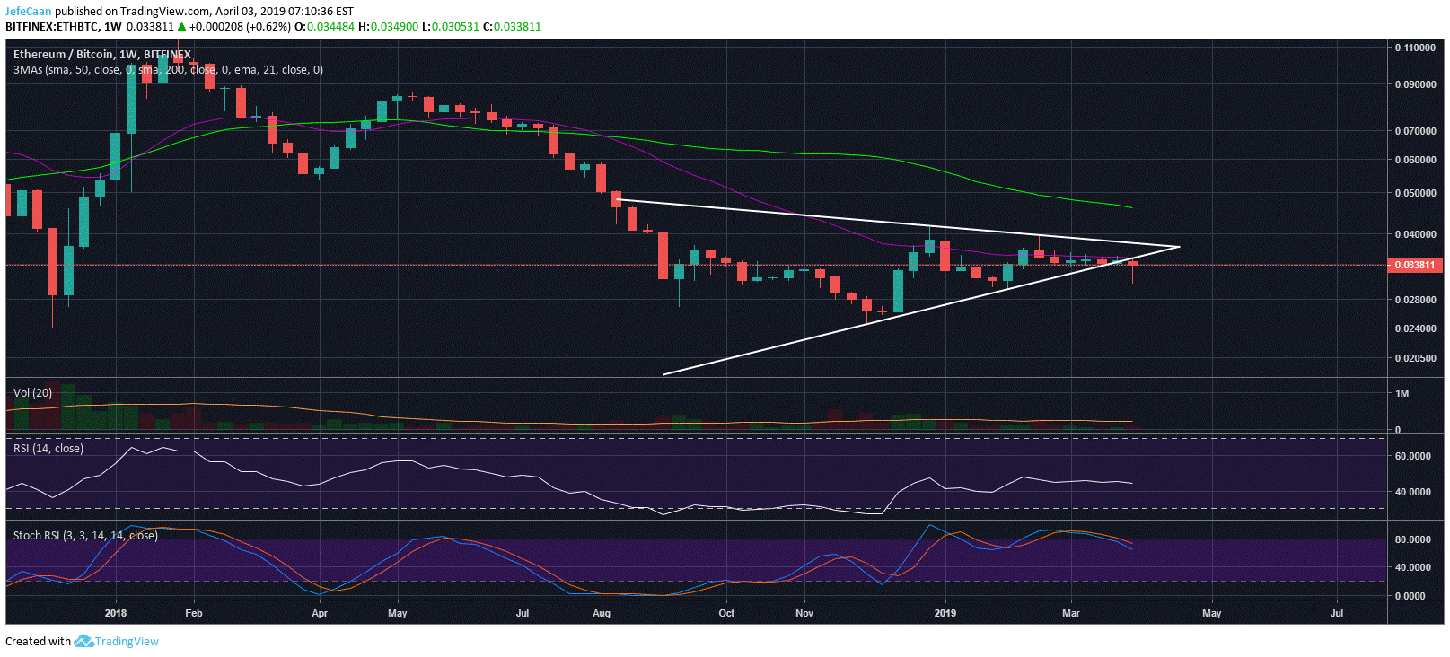
The weekly chart for ETH/BTC shows that the price has now declined below the symmetrical triangle and has already tested the trend line support as resistance. This means that ETH/BTC is expected to decline sharply in the weeks ahead as it has already broken below the symmetrical triangle. While ETH/USD seems to show a lot of strength having painted strong bullish candles near the top of its symmetrical triangle, ETH/BTC depicts the true state of Ethereum (ETH) at the moment. The price is extremely vulnerable and could see significant further downside as Bitcoin (BTC) and the rest of the market starts to decline.
As always, this next decline will catch a lot of overly ambitious traders off-guard and the whales will have their way as always. As long as ETH/BTC remains below the 21 week exponential moving average, there is no hope of a bullish comeback. The weekly chart for ETH/USD might paint a different picture at the moment but it all comes down to Bitcoin (BTC) sooner or later. Stochastic RSI for ETH/BTC shows that the price is overbought on the weekly time frame and is now ready for a steady decline in the weeks ahead. For investors who would rather stay in crypto than cash out in fiat, it might be a good idea to convert some holdings into Bitcoin (BTC).
Investment Disclaimer


