Published
5 years ago on
April 05, 2019

Bitcoin (BTC) is struggling to get back above $5,000 again but so far it has failed miserably. The 1H chart for BTC/USD shows that the price visited the 38.2% fib retracement level a number of times after falling below it but has failed to break past it. We saw an hourly candle close above this level but it was soon followed by another candle to the downside. The Stochastic RSI is now extremely overbought on the 1H time frame which means BTC/USD is long overdue for a sharp decline to the downside. This is significant because this is the last general trading day of the week. Most professional traders do not take weekend trading activity very seriously which means it will be important to see how the price closes today.
The current outlook of BTC/USD points to a sharp decline by the end of the day. The price could move sideways the next two days of the week but a strong move to the upside is not expected. All of this points to a close below the 50 week EMA for Bitcoin (BTC) which is going to be the final nail in its coffin for a series of declines in the weeks ahead. Most traders and analysts giving a lot of weightage to Bitcoin (BTC)’s own charts and trading activity need to realize that this is a very small market which is easily affected by moves in bigger markets, especially the stock market. For weeks now the S&P 500 has been trading in overbought conditions and expecting a sharp decline. The way the S&P 500 closes today is going to be a lot more important than what Bitcoin (BTC) does in the remaining two days of the week.
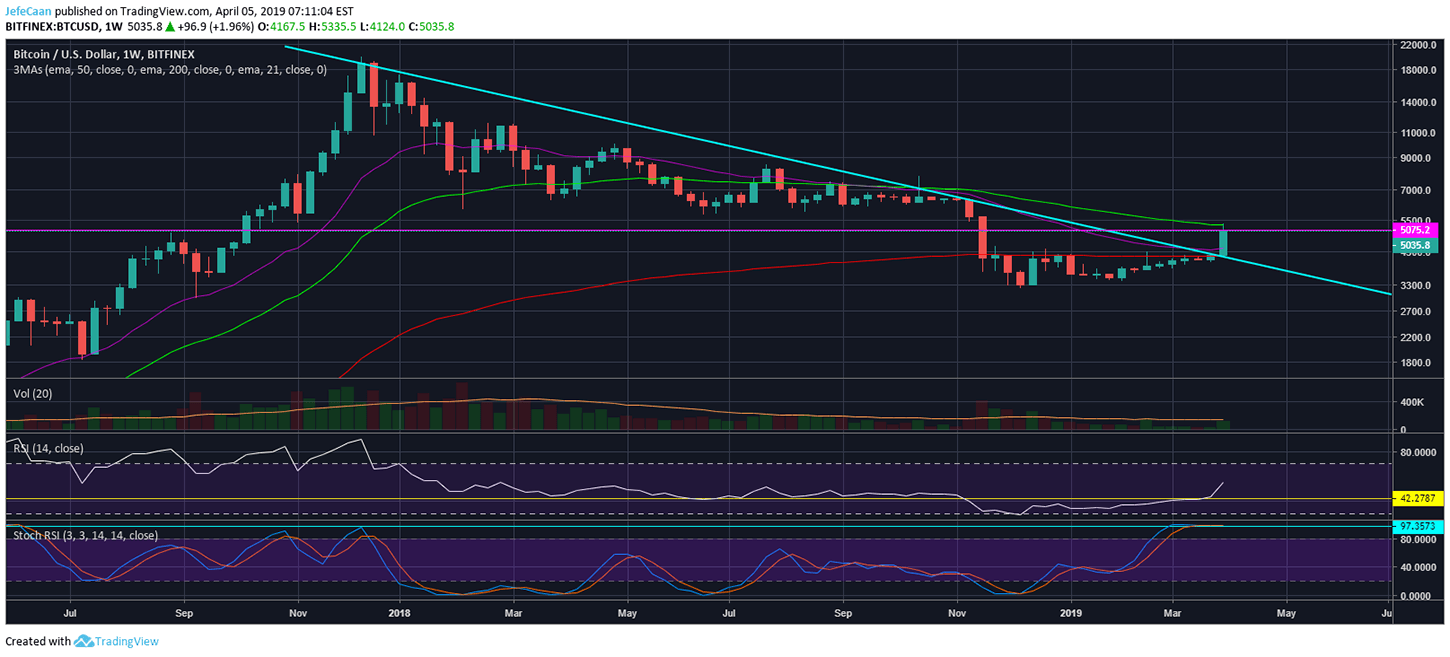
The weekly chart for BTC/USD shows that the price has faced a strong rejection at the 50 week EMA. If things remain the same, we could expect a close below this level which would translate into another bloodbath before most traders can even prepare for it. The recent few moves to the upside have once again turned the sentiment from bearish straight to bullish. This is always alarming to see because market movements that are not sustainable often end up punishing amateur investors for acting on impulses rather than doing their due diligence. The price pumped the past few days but the majority of traders turned bullish without questioning the reasons or the intent behind the pump.
While most retail traders make investment decisions based on a few green or red candles to either side or some imaginary line being broken, professional traders look at key indicators that have worked for years in traditional markets. Apart from clear support and resistance zones, certain moving averages give us a clear idea as to what is going on in the market. The 50 week exponential moving average has been crucial during the bear market of 2015 which is why there is no reason to assume a break above or below it would be inconsequential this time. The Stochastic RSI on the weekly time has never been this overbought even when Bitcoin (BTC) topped out in January, 2018. This goes on to show how much the price risks a strong decline from here that may very well pull the price to $1,800 or lower levels.
Investment Disclaimer