Published
5 years ago on
April 19, 2019
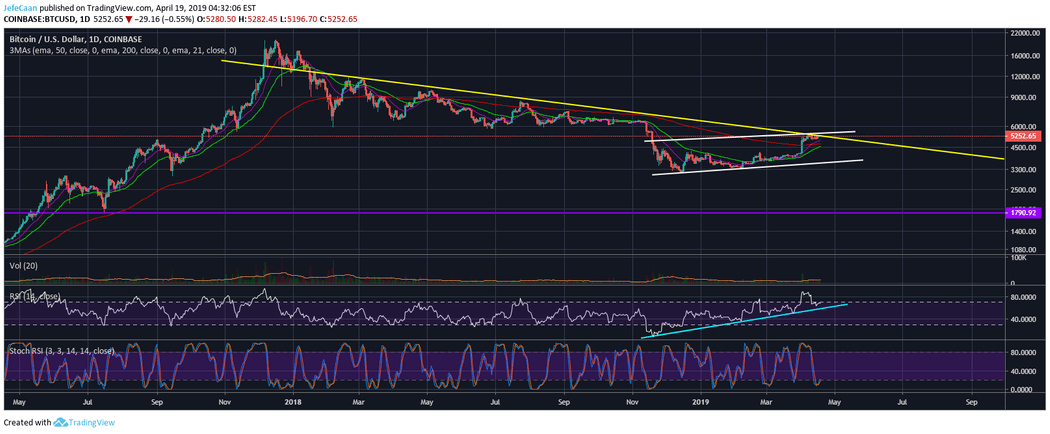
Bitcoin (BTC) is now massively overbought on the weekly time frame and is due for a big fall. The NVT indicator is signaling a fall on both the weekly as well as the daily time frames but we have reasons to believe that the price might lure some bulls in trap before the next big fall. The Stochastic RSI is near oversold territory on the daily time frame for BTC/USD and there is ample room for a rally towards the next resistance zone around $5,800-$6,000. We have seen most analysts turn from overly bullish to overly bearish in a very short term. This is never a good sign and it indicates that there is still a lot of confusion in the market. This state of confusion and uncertainty suits the whales that use it to their advantage by trapping both bulls and bears on each side.
Now that it is clear to most people that the price of Bitcoin (BTC) is due for a big fall in the weeks ahead, most traders are looking to enter short positions. Now, the mistake most traders make is that they rush into positions instead of waiting for the setup to come to them. There is absolutely no doubt that the price is due for a major decline sooner or later. However, it has to be understood that the market makers could play around with the price to trap in more traders before the decline actually sets in. This time, the conditions are ripe for creating more confusion as the daily RSI for BTC/USD shows that the price has ample room to rally to the upside. While a rally to $5,800-$6,000 is going to be too obvious, something similar might still happen.
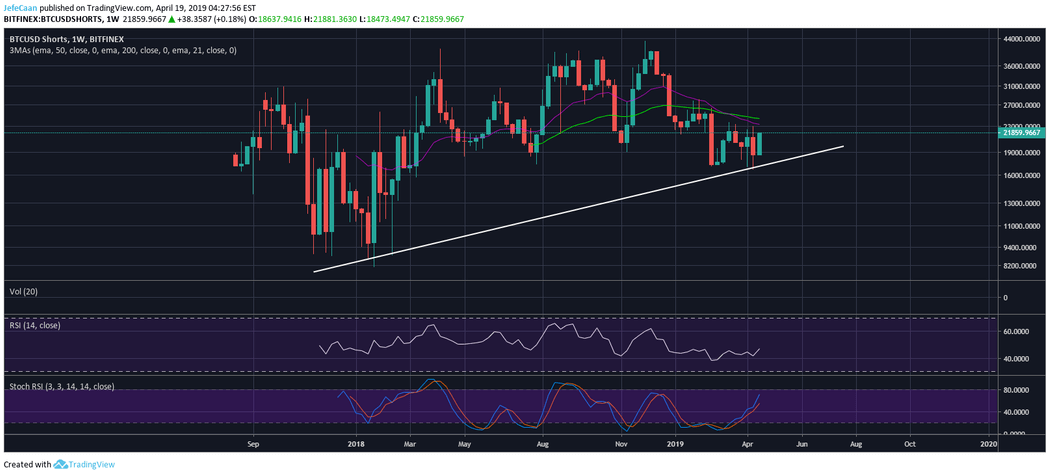
One likely scenario is that we might see a sharp move to the downside followed by a rally which then leads to the final corrective wave to the downside that will see BTC/USD find its true bottom. The reason we expect it to play out like that is because of two reasons. First of all, the price of Bitcoin (BTC) as well as the weekly chart for BTCUSDShorts shows that there is plenty of room for confusion. The weekly chart for BTCUSDShorts has its Stochastic RSI nearing overbought territory. This means that we could expect BTC/USD to fall as the number of margined shorts rises in the weeks ahead.
As the number of margined shorts rise and BTCUSDShorts tops out, we could expect BTC/USD to start rallying. This is the most likely scenario based on the price action. However, if we look at the charts, every market cycle in Bitcoin (BTC) history has taken longer to complete compared to the previous one. If the same is going to happen this time, then Bitcoin (BTC) has to see weeks of indecisive movement. While we still believe the price is going down to $1,800 or lower, we believe that it may take as long as September, 2019 for that to happen.
Investment Disclaimer