Published
5 years ago on
March 28, 2019
Bitcoin
Bitcoin (BTC/USD) extended recent gains during today’s Asian session as the pair got as high as the 4035.80 level, after absorbing technical Resistance around the 4009.52 area, representing the 76.4% retracement of the 4056.33 – 3858.00 range. Price activity is now trading above 50-bar MA, 100-bar MA, and 200-bar MA on both Hourly and 4-Hourly charts. As noted in our 27 March 2019 analysis, traders tested the 3984.88 level without much resistance and are working to establish a base above the key technical level, representing the 61.8% retracement of the move from 4188.79 – 3655.00.
Technical Support is expected around 3815.17/ 3763.33/ 3684.13/ 3620.14 with Stops expected below.
Technical Resistance is expected around 4062.82/ 4111.39/ 4188.79/ 4239.37 with Stops expected above.
Upside price objectives remain around the 4163/ 4358/ 4673 levels.
On 240-minute chart, SlowK and SlowD have converged while MACD is Bullishly above MACDAverage.
On 60-minute chart, SlowK is Bearishly below SlowD while MACD is Bearishly below MACDAverage.
Ethereum
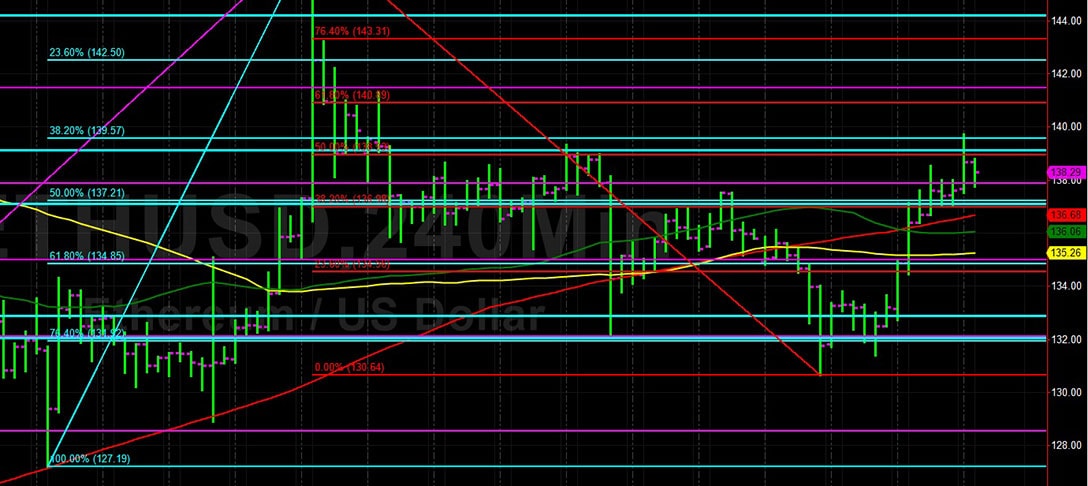
Ethereum (ETH/USD) continued to appreciate during the Asian session, trading as high as the 139.71 level, before some selling pressure emerged and pushed the pair back below the 138.00 figure. Today’s intraday High was just above the 139.57 area, representing the 38.2% retracement of the 127.19 – 147.23 range. Technicians are eyeing the 137.88 area during today’s pullback, representing the 38.2% retracement of the 122.75 – 147.23 range. ETH/USD is trading above 50-bar MA, 100-bar MA, and 200-bar MA on both 240-minute and 60-minute charts.
Technical Support is expected around the 134.56/ 129.34/ 128.53 levels with Stops expected below.
Technical Resistance is expected around the 140.89/ 141.45/ 143.05 levels with Stops expected above.
Downside price objectives remain around the 119.57 level.
On 240-minute chart, SlowK has Bearishly crossed below SlowD while MACD Bullishly remains above MACDAverage.
On 60-minute chart, SlowK is Bearishly below SlowD and MACD is Bearishly converging with
MACDAverage.
Litecoin
Litecoin (LTC/USD) galloped higher and traded as high as the 61.50 level before some profit-taking emerged during the Asian session. Today’s intraday High was the pair’s strongest showing since 17 March and emerged after several attempts to climb above the 60.94 level, representing the 76.4% retracement of the 62.22 – 56.80 range, and a key level identified in our 27 March 2019 analysis. On a 4-Hourly chart, the 50-bar MA is around 59.32 and chartists are waiting to see if this level will provide technical Support. Interestingly, the 50-bar MA (59.32), 100-bar MA, and 200-bar MA are within USD 0.05 of each other on an Hourly chart.
Technical Support is expected around the 57.54/ 54.48/ 48.33 levels with Stops expected below.
Technical Resistance is expected around the 62.09/ 65.60/ 66.80 levels with Stops expected above.
Upside price objectives remain 74 level.
On 240-minute chart, SlowK and SlowD have converged while MACD remains Bullishly above MACDAverage.
On 60-minute chart, SlowK is Bearishly below SlowD while MACD remains Bearishly below MACDAverage.
Bitcoin Cash
BCH/USD (Bitcoin Cash/ US dollar) continued to rally during today’s Asian session, reaching an intraday High around the 172.99 area before coming off. Decent Stops were elected above the 171.41 level, representing the 38.2% retracement of the 73.22 – 232.10 range. BCH/USD continues to trade far above the 50-bar MA (159.79), 100-bar MA, and 200-bar MA on a 4-Hourly chart, and above the 50-bar MA, 100-bar MA (161.88), and 200-bar MA on an Hourly chart.
Today’s intraday High is the pair’s strongest showing since 2 January 2019.
Technical Support is expected around the 165.03/ 162.64/ 158.76 levels with Stops below.
Technical Resistance is expected around the 174.99/ 177.90/ 186.47 levels with Stops above.
Downside price objectives remain the 110 and 82 levels.
On 240-minute chart, SlowK and SlowD have Bearishly converged while MACD remains Bullishly above MACDAverage.
On 60-minute chart, SlowK has Bearishly crossed below SlowD while MACD has Bearishly crossed below MACDAverage.
Investment Disclaimer