Published
5 years ago on
March 18, 2019
BTC/USD (Bitcoin/ US dollar)
Bitcoin (BTC/USD) extended its climb Higher following Saturday’s test of the 4037.47 level, below which Stops were elected above the 4026.62 level, representing the 76.4% retracement of the move from 4239.37 to 3337.87. Saturday’s activity represented the pair’s Highest prints since 24 February. Sunday’s price activity saw consolidation down to the 3936.30 level, right around the 50-bar MA (Hourly), before BTC/USD found Bids during today’s Asian session.
Additional Stops were elected today above the 3986.89 and 3998.82 levels, representing the 50% and 61.8% retracements of Saturday’s High to Sunday’s Low. Additional Stops are expected above the 4013.59 level, representing the 76.4% retracement of the same range.
Technical Support is expected around 3938.66/ 3877.79/ 3763.33/ 3684.13/ 3620.14 with Stops expected below.
Technical Resistance is expected around 4062.82/ 4111.39/ 4188.79/ 4239.37 with Stops expected above.
Upside price objectives remain around the 4163/ 4358/ 4673 levels.
On 240-minute chart, SlowK is marginally above SlowD and MACD is marginally above MACDAverage. The 50-bar MA is now around 3894.35 with the 100-bar MA and 200-bar MA around 3857 and 3818.
On 60-minute chart, Price activity has generally been supportive around the 50-bar MA (3974.48) since Thursday’s sharp volatility that saw a quick depreciation to 3779.28. SlowK is Bullishly outpacing SlowD and MACD is Bullishly diverging from MACDAverage.
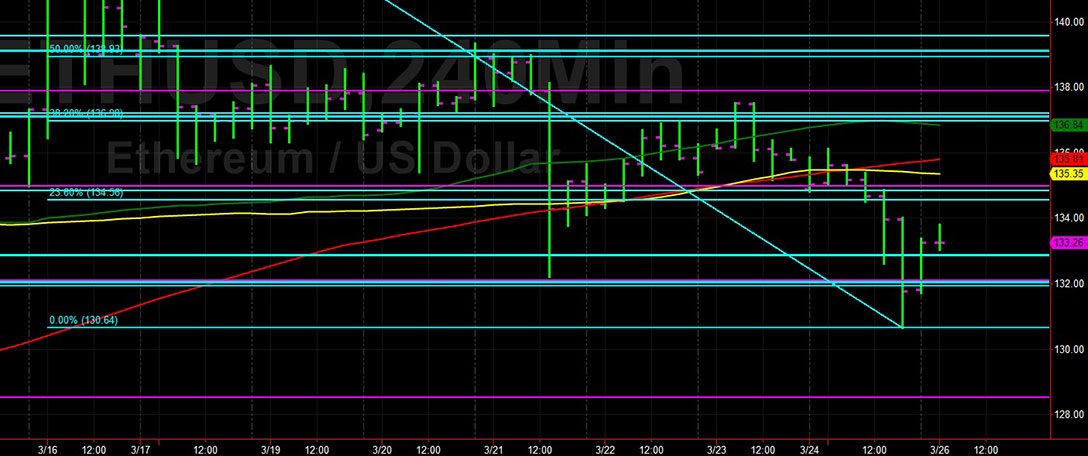
ETH/USD (Ethereum/ US dollar)
Ethereum (ETH/USD) climbed Higher during today’s Asian session following Saturday’s ascent to the 147.23 level, representing the 38.2% retracement of the 255.00 to 80.60 range. Price activity receded on Sunday to the 136.30 level before being lifted Higher to the 141.30 level during today’s Asian session.
Stops were elected above the 140.48 level during today’s activity, representing the 38.2% retracement of Saturday’s High to Sunday’s Low.
Technical Support is expected around the 137.88/ 134.90/ 132.10 levels with Stops expected below.
Technical Resistance is expected around the 143.05/ 144.19/ 147.22 levels with Stops expected above.
Downside price objectives remain around the 119.57 level.
On 240-minute chart, SlowD remains Bearishly above SlowK while MACD and MACDAverage have converged. The 200-bar MA is nearest Price activity at 134.88.
On 60-minute chart, Price activity is orbiting the 50-bar MA (139.27) with the 100-bar MA around 136.00. SlowK is Bullishly above SlowD and MACD is Bullishly above MACDAverage.
LTC/USD (Litecoin/ US dollar)
Litecoin (LTC/USD) rallied strongly during today’s Asian session as the pair jumped Higher to the 62.22 level, eclipsing Saturday’s High of 61.58. Stops were elected above the 61.06 level during today’s climb Higher, representing the 76.4% retracement of Saturday’s High to Sunday’s Low.
Today’s intraday High is just below the 50% retracement (62.62) of the move from 103.06 to 22.17.
Technical Support is expected around the 57.54/ 54.48/ 48.33 levels with Stops expected below.
Technical Resistance is expected around the 66.80/ 72.16/ 75.06 levels with Stops expected above.
Upside price objectives remain around the 62 and 74 levels.
On 240-minute chart, Price activity is nearest the 50-bar MA (57.01). SlowD is Bearishly above SlowK while MACD and MACDAverage have converged.
On 60-minute chart, Price activity is mostly supported by the 50-bar MA (60.53). SlowD is Bearishly above SlowK while MACD is Bullishly diverging from MACDAverage.
BCH/USD (Bitcoin Cash/ US dollar)
Bitcoin Cash (BCH/USD) exploded Higher during today’s Asian session with the pair reaching the 166.80 level, the pair’s Highest level since the first week of 2019. Friday’s High of 159.64 was easily absorbed during today’s dealing and it appears that Bitcoin Cash may have been the first major cryptocurrency to peak over the past couple of days, suggesting it led the complex Higher.
The 152.70 level has been supportive during the last several hours, representing the 50% retracement of the weekend’s High and Low. Many Stops were elected above the 156.36 level, representing the 76.4% retracement of the 159.64 – 145.76 range.
Technical Support is expected around the 156.96/ 150.87/ 145.95 levels with Stops below.
Technical Resistance is expected around the 171.41/ 186.47/ 194.60 levels with Stops above.
Downside price objectives remain the 110 and 82 levels.
On 240-minute chart, Price activity is significantly above the 50-bar MA (136.47). SlowK and SlowD are converging while MACD is Bullishly diverging from MACDAverage.
On 60-minute chart, Price activity has Bullishly been supported above the 50-bar MA (153.37). SlowD has Bearishly crossed above SlowK while MACD is Bullishly diverging from MACDAverage.
Investment Disclaimer