Published
5 years ago on
February 14, 2019
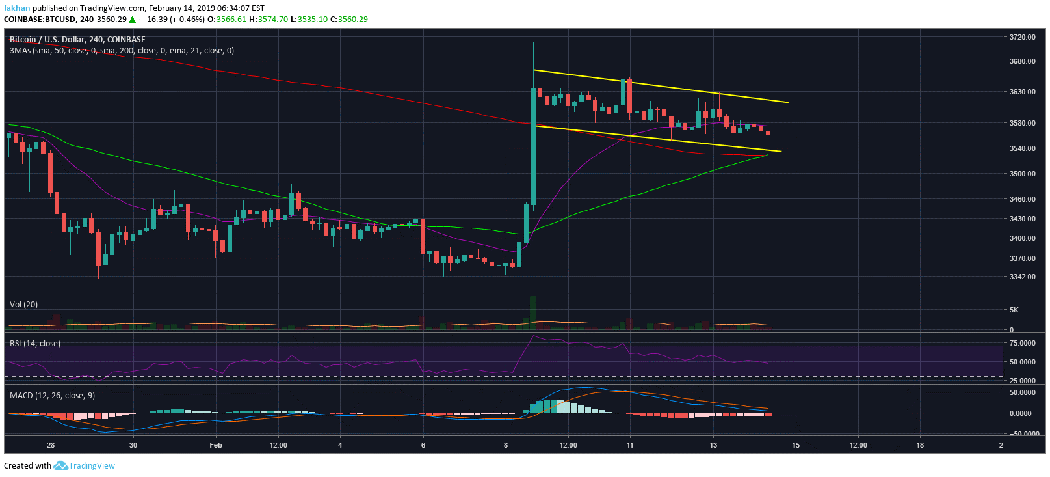
Bitcoin (BTC) has been consolidating above the 21 Day EMA for seven days in a row. The consolidation has now extended so far that the price is almost ready to break out past $3,650 as early as this week. The 4H chart for BTC/USD shows that the 50 MA is about to cross above the 200 MA. This is going to be extremely bullish if the crossover goes as expected. The price could be expected to climb above $4,000 after such a break out. It is becoming increasingly clear that Bitcoin (BTC) is preparing to test its previous market structure around $6,000. That is also the average price to mine one Bitcoin (BTC). So, we are going to see in the next few days and weeks whether BTC/USD is ready to go back to normal again.
If we are going to know that the price is not ready for a trend change yet, the only way we will get a confirmation is through a rejection at the previous market structure. This is the only way it works and it does not apply to Bitcoin (BTC) alone. In most market cycles when the price is expected to proceed with a trend reversal, it is expected to break past its previous market structure. If it does not, then traders have a confirmation that the price is going lower. However, there is no reason to be bearish at this time. In fact, it is hard to see why anyone would want to be bearish at this point. If the price goes up towards $6,000 and proceeds towards $8,000, we will have the confirmation that it has started a bullish cycle.
Similarly, if the price faces a rejection at the previous market structure, we will have a confirmation that the bear trend is not over yet. In other words, there is not much to lose by being long on BTC/USD at this point regardless of your long term bullish or bearish bias. If the price does succeed in breaking past the previous market structure and climbs towards $8,000, you would have missed the opportunity possibly forever. When you see the price going from $3,000 to $8,000 and you miss the opportunity, it is very hard to get back in regardless of where you think the price is headed long term.
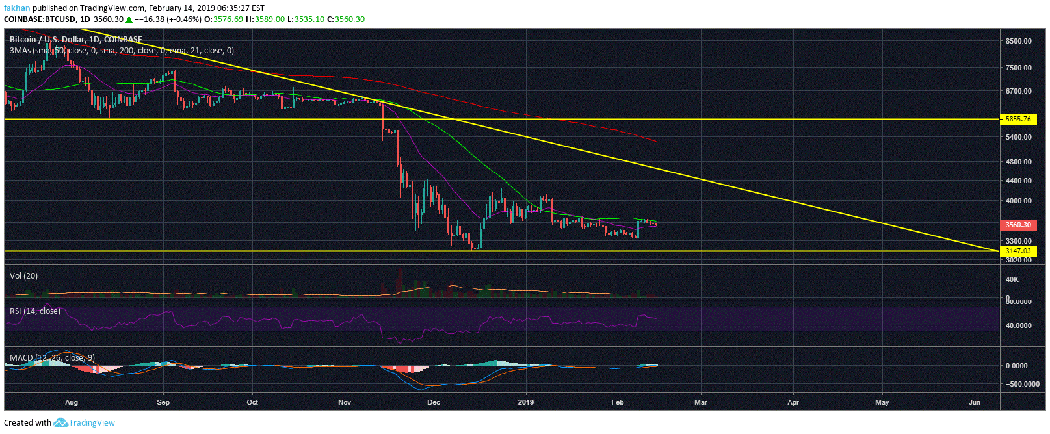
There are plenty of smart people in this market who can draw the perfect charts and use the most sophisticated indicators. However, trading requires a lot more than that. You have to be patient when there is no play but when there is an opportunity, you have to embrace it. At the end of the day, it all comes down to risk and how you manage that risk. All the lines and marks that we draw on a chart just show us the possibilities. If you analyze them further, you can deduce the probabilities as well. However, there are still a lot of other variables like position sizing and risk management that many traders ignore. The daily chart for BTC/USD shows a golden cross that will come to fruition around mid-2019. If you missed buying Bitcoin (BTC) during 2014-15, this might be your chance.
Investment Disclaimer