Published
5 years ago on
February 06, 2019

Bitcoin (BTC) has broken below a critical trend line support that held for a long time after the December, 2018 crash. This appeared to be an act of manipulation and the bulls were secretly hoping that the price would get back above the trend line but none of that happened. In fact, the price kept trending the trend line support which has now turned into a strong resistance. The last attempt to test this trend line failed miserably and BTC/USD faced a strong rejection which led to a selling spree that pulled the price down to $3,338. It soon recovered from there but has now become range bound and could be due for further sell off towards the end of the week.
Regardless of the recent sell off, it is extremely unlikely for Bitcoin (BTC) to fall straight towards its next low without correcting to the upside first. This is why we accept the price to first climb towards the previous market structure. If a retest of the market structure around $6,000 fails, only then will the price have a better probability of falling towards a new low. The 200 Week MA is a very strong support and has never been broken once during Bitcoin (BTC)’s entire trading history. There is no reason to believe that it will be broken this time, not when Bitcoin (BTC) has not even faced a rejection at the previous trend line. It is still possible that the price may shoot straight above the previous market structure without facing a strong rejection.
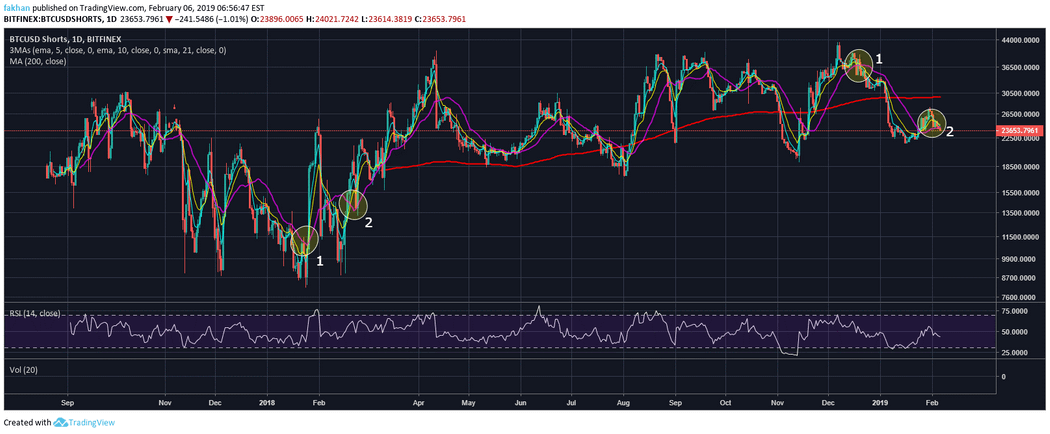
The situation currently appears to be in favor of the bears as the price has once again crashed after a long time of consolidation. However, it would not be prudent to assume that BTC/USD is going to crash again because it crashed the last time after consolidation. If anything, one would be right to assume the opposite at this time just when everyone is expecting further sell off. That being said, there is a strong probability that both things may happen such that neither the bulls nor the bears but the whales have the upper hand. We can already see signs of such an event if we look at the daily chart for BTCUSDShorts. The whales have confused both the bulls and the bears at the same time.
On one hand, they have conveyed a message to the bulls that the price has broken below a critical trend line support which has now turned into resistance, so BTC/USD may have a hard time climbing back above it and could face significant further sell off. However, on the other hand, the number of shorts on the daily chart for BTCUSDShorts has broken and closed below the 21 Day EMA for the first time since the December, 2018 sell off. This tells the bears that the number of shorts could decline aggressively anytime now. My understanding is that the whales wanted to make the situation as confusing as possible and they have done an excellent job at that. I believe that the price is more likely to climb towards $4,000 than to fall towards $3,000 but given the state of confusion in the market, blood will be spilled before that happens.
Investment Disclaimer