Published
5 years ago on
January 10, 2019
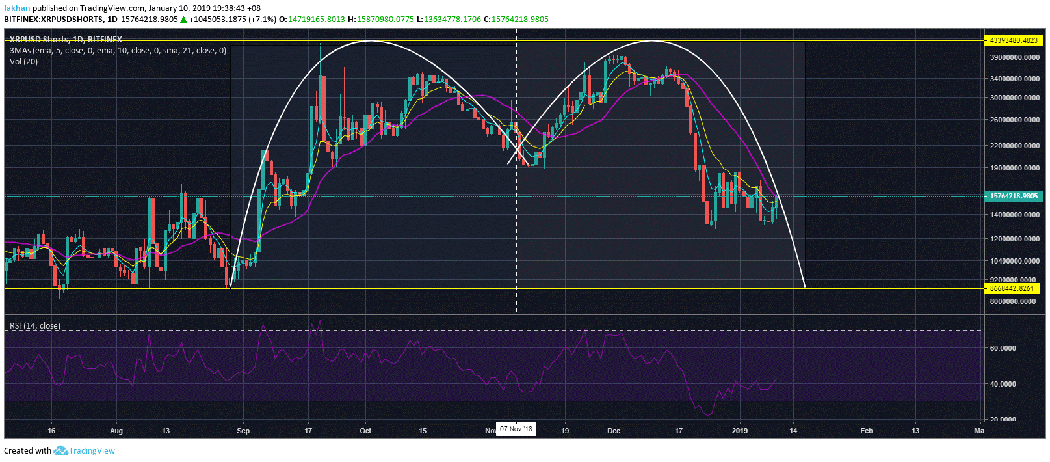
Ripple (XRP) shorts were quick to celebrate victory but the bulls have not let go yet. The recent crash did damage the bullish resolve in a big way but this does not mean that the bears are back in charge. In fact, the daily chart for XRPUSDShorts shows that this so called victory is likely to be very short-lived. The number of shorts has now run into the 21 Day EMA which is a strong level to breach. The most likely scenario is that the number of shorts will continue to decline in the days ahead to retest August, 2018 lows. If Bitcoin (BTC) rallies strongly during this point, then we can expect XRPUSDShorts to fall below support which would give the bulls the green signal they need to take XRP/USD towards its previous all-time high.
Until recently, it appeared that Ripple (XRP) like most cryptocurrencies will trade sideways for the next few years before it reaches its previous all-time high. However, rapidly changing conditions on the economic front across the globe have once again sparked the possibility of a 2017 styled rally in 2019. For all we know, it could be a false hope signal and we may actually have to wait for a few more years until the price begins to rally. However, it is important to note that regardless of all that, this is one of the best times in history to be long on Ripple (XRP). The price is at a very favorable point and the future outlook is brighter than ever. The risk/reward is quite low which is why Ripple (XRP) is one of the most popular investments in the cryptocurrency market.
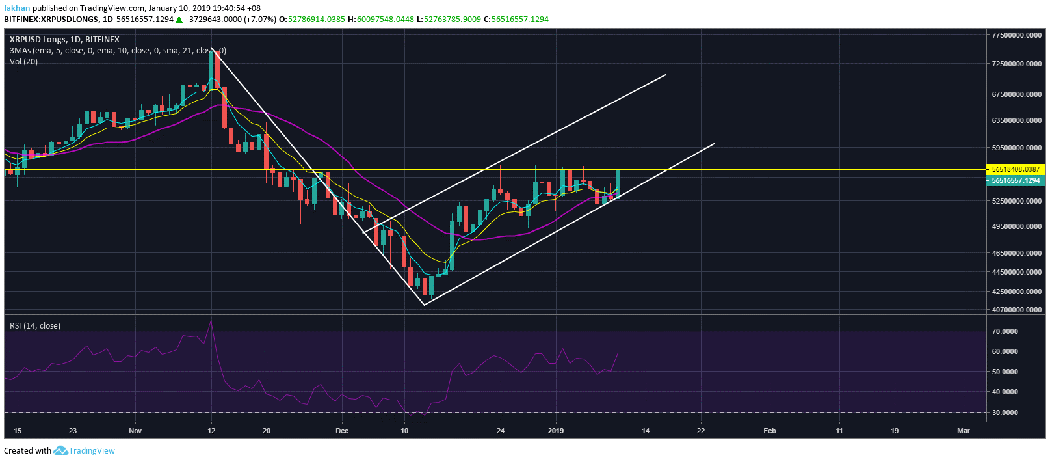
Being long on Ripple (XRP) now that XRPUSDLongs has successfully broken above the 21 Day EMA is definitely a good idea. The current candle has yet to close above the 21 Day EMA but there is a high probability that it will close around the same level it is at if not higher. Bitcoin (BTC), Ripple (XRP) and EUR/USD share the same outlook in this regard. All three are close to reaching overbought conditions as shown by the RSI on the daily time frame. However, all of them have broken above the 21 Day EMA and expected to close the candle above it today. Such a bullish confirmation takes precedence over the price being oversold or overbought short term because the RSI follows the price of an asset, not the other way around.

We do see a large bear flag on the daily chart for XRPUSDLongs which is an alarming sign. However, recent events are beginning to paint an Inverse Head and Shoulders formation within this bear flag. The head and the left shoulder are already there and depending on how the price closes today, we may get the right shoulder as well. This kind of setup could swing either way but the odds of it breaking to the upside are much higher.
Investment Disclaimer