Published
5 years ago on
January 03, 2019
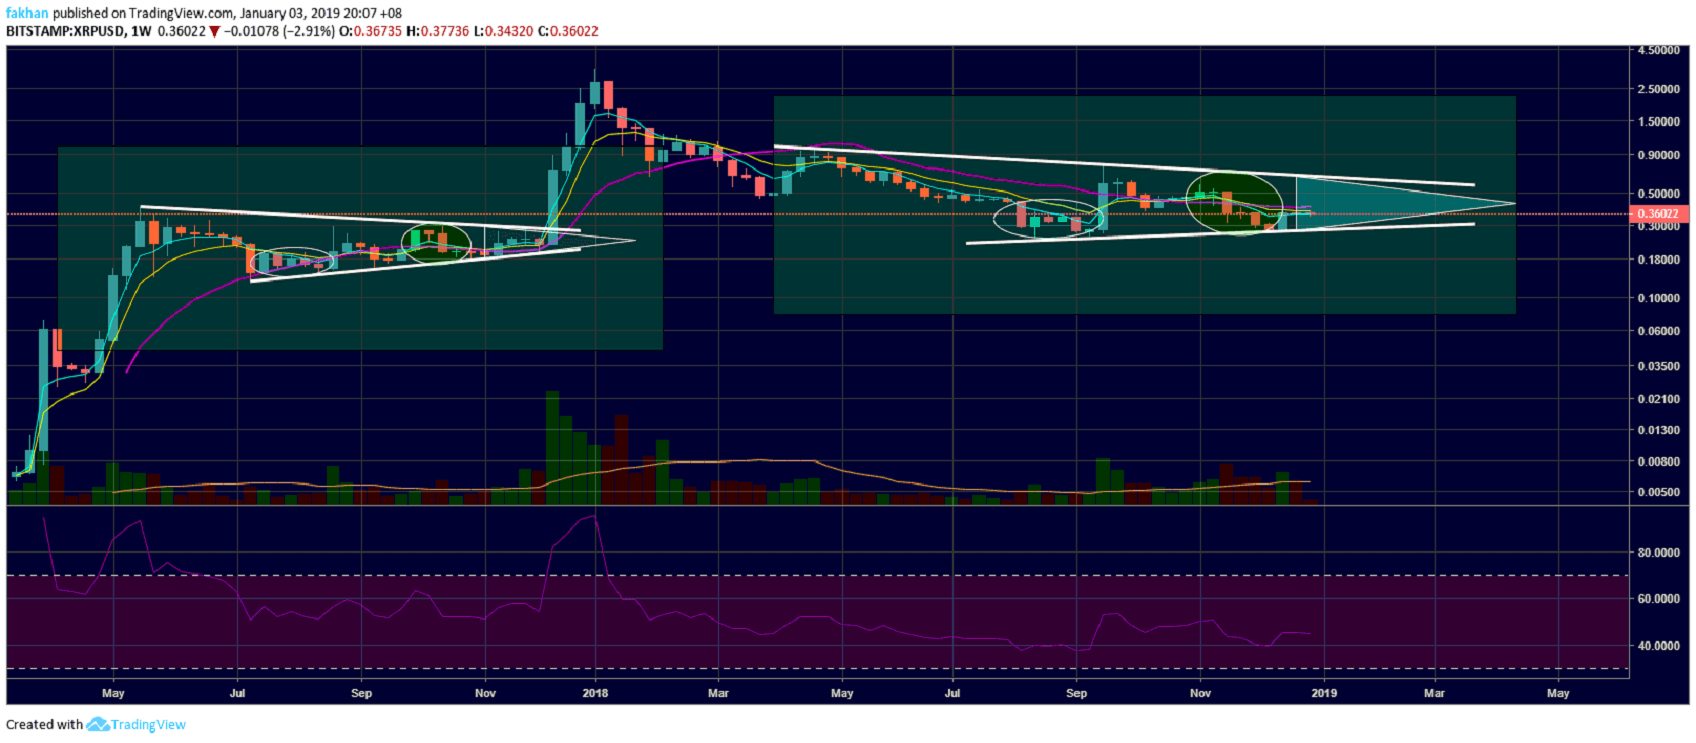
Ripple (XRP) is on the verge of a historic breakout. The last time XRP/USD printed this pattern on the weekly time frame, we saw Ripple (XRP) rise to a new all-time high. Now, the question is, “Could the same happen this time?” Throughout the trading history of Ripple (XRP) we have seen it print the same patterns as it has before. For instance, XRP/USD prints the same four consecutive long candles when it breaks out against Bitcoin (BTC). We have seen this happen many a time before. The interesting part is, largely the whole price action leading up to the rally seems the same as before.
Even if we look at the RSI for XRP/USD in the past few months and compared it to the one between September and December of 2017, we can see that the exact same scenario is likely to repeat again. The fractals for the two breakouts look incredibly similar as well. It appears that XRP/USD has now ented the triangular part of the diagram which means it will trade sideways inside it for the next five weeks or more before it breaks out towards a new all-time high. If we compare the triangular sections of both the fractals, we cans see that XRP/USD is in the exact same situation with the 21 Wee EMA as it was back in late 2017 when it was trading in a similar triangle. It took the price five weeks to get ahold of the 21 Week EMA.

After five weeks, the price shot straight through the 21 Week EMA and made a new all-time high. The price is now doing the exact same thing but it may take a bit longer than five weeks. That being said, there is no denying that there is a very strong probability that the exact same thing is going to happen again. Ripple (XRP) like most altcoins have yet to rally against Bitcoin (BTC) which is when we will see the altcoin season begin. It is hard to see how altcoins might be able to rally hard against Bitcoin (BTC) at a time when Bitcoin (BTC) is expected to remain range bound. However, this is exactly what has happened in the past and there is no reason to think that the same may not happen this time.
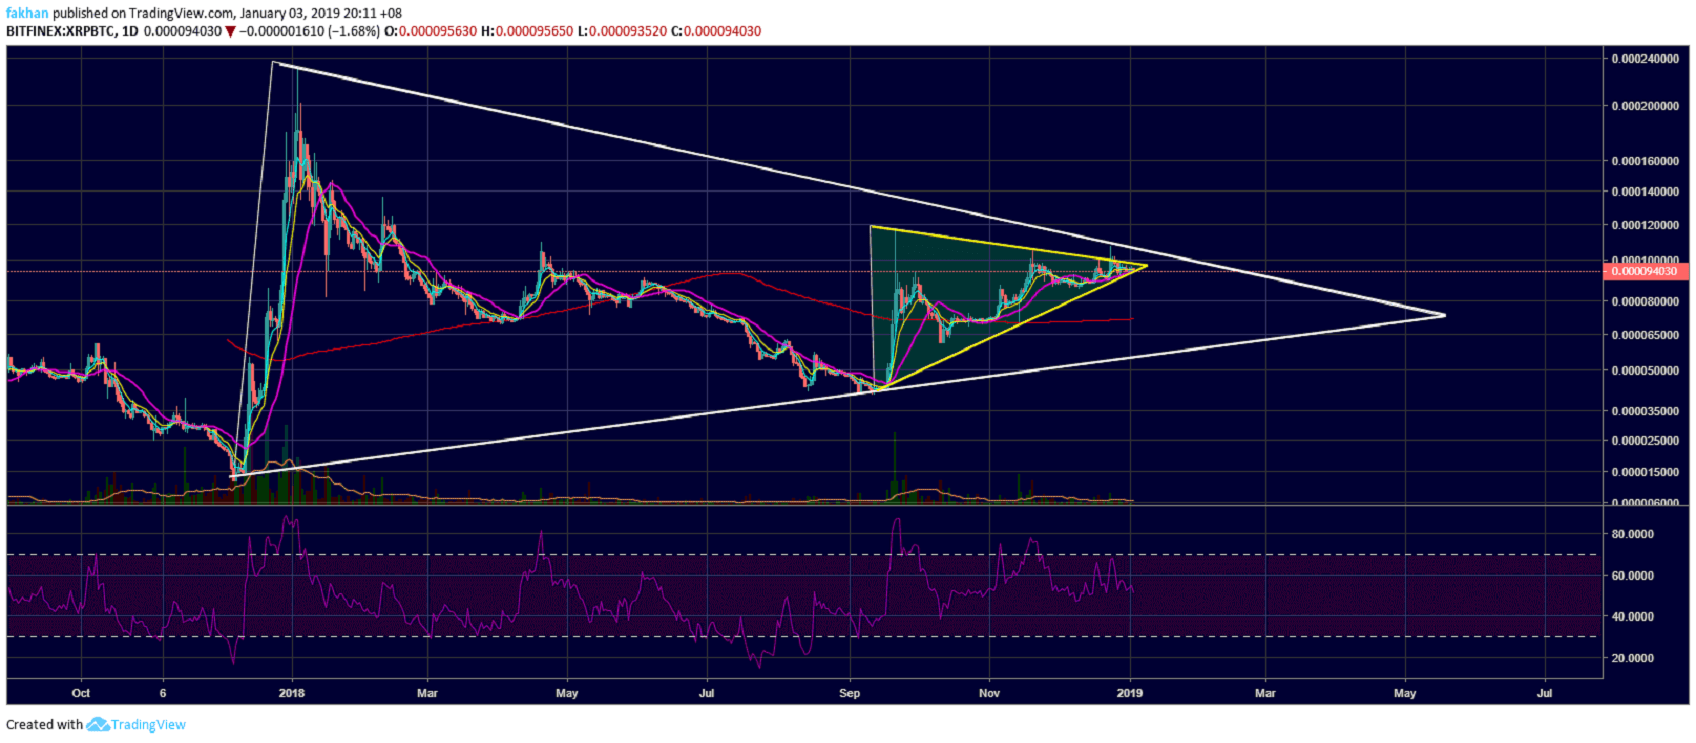
Ripple (XRP) is due for a breakout against the US Dollar (USD) but it is due for an even more aggressive breakout against Bitcoin (BTC) which may take place before the break out against the US Dollar (USD). As the daily chart for XRP/BTC shows, Ripple (XRP) has formed a major bullish pennant trading against Bitcoin (BTC). Now, the interesting part is, when Ripple (XRP) could not rally in one go, it formed another bullish pennant inside the major bullish pennant. The smaller bullish pennant on the XRP/BTC chart is likely to pave the way for a break out of the larger pennant to the upside. This will give Ripple (XRP) the opportunity to reach a new all-time high not just against the US Dollar (USD) but also against Bitcoin (BTC) in the months ahead.