Published
5 years ago on
January 15, 2019
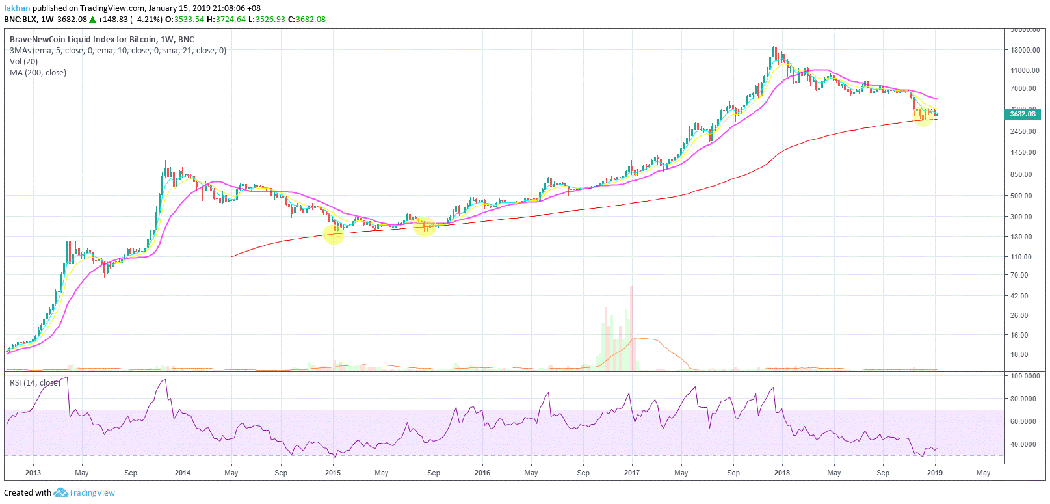
During the last four years, Bitcoin (BTC) has touched the 200 Week MA three times. During all of these three encounters, BTC/USD has not closed the weekly candle below the 200 Week MA. The price has dropped below the 200 Week MA but it was back above the line before the end of the week. This goes on to show that the 200 Week MA is the best indicator for Bitcoin (BTC) bottoms. Another important observation from the above chart for BNC:BLX (Brave New Coin Liquid Index For Bitcoin) is that every time Bitcoin (BTC) has touched the 200 Week MA, it has successfully rallied to test the 21 Week EMA. This happened twice in 2015 and considering that we have are bouncing off the 200 Week MA this time, it is reasonable to expect that this may occur again.
If Bitcoin (BTC) were to retest the 21 Week EMA this time, it would coincide with a price target of $6,500 which is exactly what we have been calling for during our previous analysis. This is because a price target of $6,500 corresponds to Bitcoin (BTC)’s previous market structure which will now serve as a resistance. In order for Bitcoin (BTC) to become range bound for the remainder of 2019, it is imperative that it will have to face rejection at the previous market structure. Therefore, it is going to retest it sooner or later. The most likely scenario is that this level is going to be tested in the next few weeks towards the end of the month. There is also a very high probability that Bitcoin (BTC) will face rejection at this level and fall below $4,000 again.
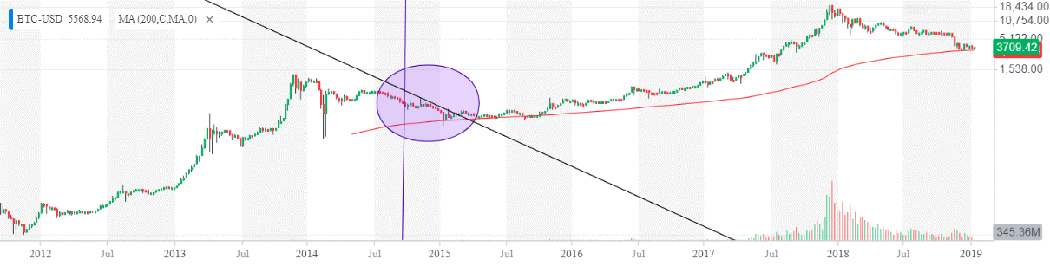
However, it is important to realize at this time that Bitcoin (BTC) is not following the 2014-15 cycle down to the letter. Yes, there were some parts of the cycle that were reproduced but there are a lot of differences as well. A lot of people are comparing Bitcoin (BTC)’s current cycle to that of 2014-15 and claiming that we are at the same point as Bitcoin (BTC) was during September, 2014. If we look at the BTC/USD chart for September, 2014 (shown by purple line), we can see that it dropped heavily after that level to fall down to the 200 Week MA.

Now, here is where it gets interesting. If we compare it with today’s charts, we can see that we have already tested the 200 Week MA and a fall like the one after September, 2014 would mean a crash below the 200 Week MA. Considering that the 200 Week MA is a far better indicator of bottom (based on last four years of trading history) than some part of the 2014-15 cycle people think is going to repeat, it would be reasonable to assume that Bitcoin (BTC) has already bottomed out. If Bitcoin (BTC) were to fall and close below the 200 Week MA, to follow the September 2014 fractal, that would mark the beginning of a new bear market where we would be looking at three digit prices.
Investment Disclaimer


