Published
5 years ago on
December 12, 2018
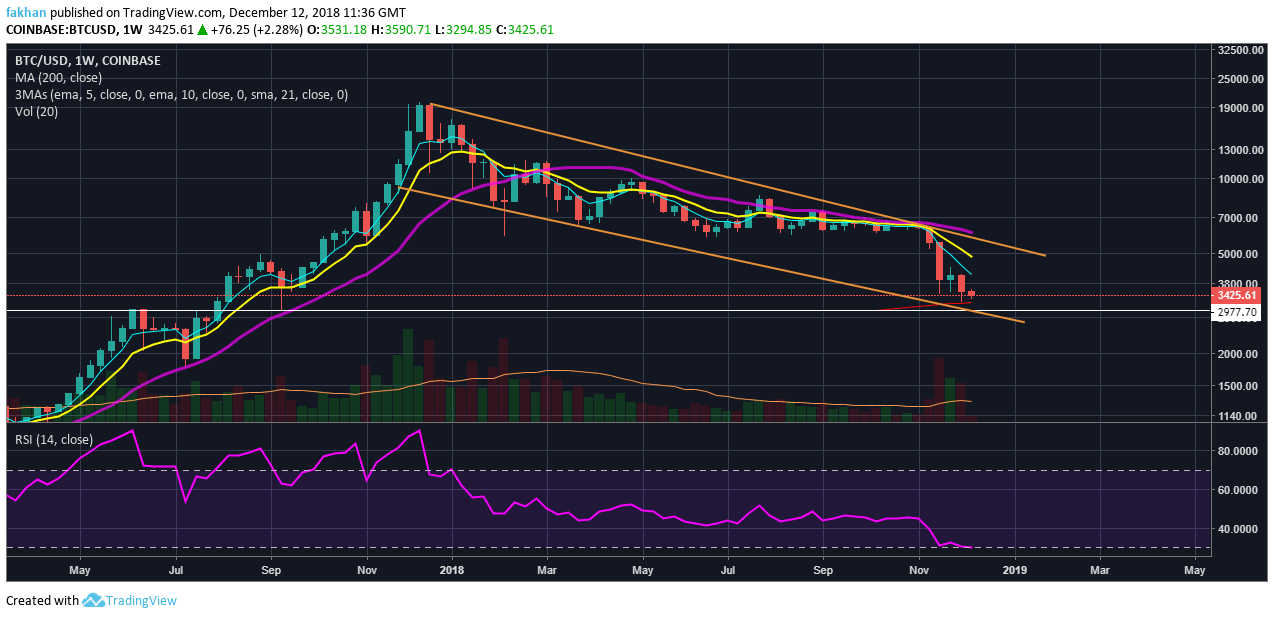
Bitcoin (BTC) is about to complete a yearlong correction which has put a lot of things in perspective. It is now clear that BTC/USD was trading in a descending channel the whole time. Bitcoin (BTC) tested the top of this channel for the first time in October. It kept testing it in November and then finally continued to drop back into the channel after facing a strong rejection. This rejection was significant because it pushed the price below the 21 Week EMA. Currently, the price seems to be at the bottom of this descending channel but it has yet to touch the trend line. So far, this has not happened which is why we believe that a fall below $3,000 is in the offing.
The weekly chart for BTC/USD shows that $2,977 is a very strong support that the price has not tested yet. Testing this support will have important consequences. First of all, Bitcoin (BTC) will get to drop down to the 200 Week EMA. The price settled just above this level last week and disappointed a lot of investors who were expecting a reversal. As for traders, this gap meant more opportunities to trade. It was expected that the price will drop again to fill that gap. Currently, the price has three reasons to drop below $3,000. The first one is a test of the 200 Week EMA. The second one is a test of the historical support at $2,977 and the third one is a test of the bottom of the descending channel. All of these are compelling reasons to believe that the price will fall below $3,000 in the days ahead.
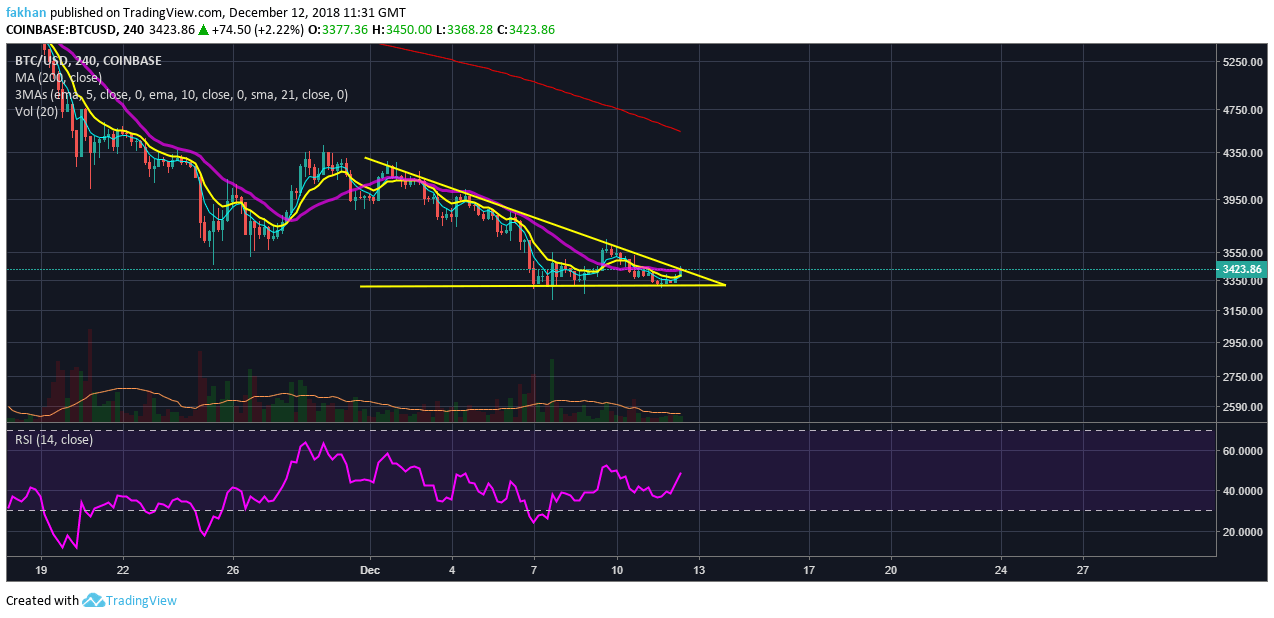
As much as most Bitcoin (BTC) believers would like to be over and done with this correction to see the price rise again, the reality is that the price is going nowhere without convincing investors that the correction is truly over. The best way to do that right now is to test that historical support and bounce strongly off it. The daily as well as the weekly RSI is in oversold territory but shorter time frames point to a strong probability of a fall in the next few days. The 4H chart for BTC/USD shows the price trading in a descending triangle. It is all set for a big fall soon as the price falls below this triangle. RSI for the 4H chart has ample room for a fall.

Bitcoin (BTC) currently faces strong rejection at 21 EMA on the 4H chart. If the price fails to break above this triangle, we could see it start to fall in the next few hours with a sharp decline in as early as 48 hours. This decline was expected since the beginning of the week but it was timed such that it could be prolonged till the end of the week. Over the next few days, towards the end of the week, we are likely to see the price decline sharply towards $3,000. Over the weekend, it is highly probable that the price will attempt to break slightly below $3,000 to test the historical support at $2,977.
Investment Disclaimer


